# Beyond the Baseline: Buying AI Inference Capacity for the Workloads Nobody Budgeted

> AI inference capacity is sold out and mostly idle at the same time, because it is bought for the daily baseline while the workloads that break the budget were never in the plan. Here is the market, the math, and the contract that fits them.

Source: https://savrn.com/blog/ai-inference-capacity-beyond-the-baseline
Author: Chad Everett Harris
Published: 2026-09-19

---

Two numbers about AI inference capacity in America are both true this year, although they appear to contradict each other.

The first number is 1.4 percent. That was the vacancy rate across CBRE's eight primary North American data center markets at the end of 2025, a record low, while asking rates were up a fourth consecutive year.[1] By spring 2026, SemiAnalysis was describing on-demand H100 and H200 capacity as effectively sold out across the providers it surveys.[2] Microsoft has told investors in four consecutive earnings calls, starting in April 2025, that Azure's AI demand exceeds its available capacity,[3] while the median power project that reached commercial operation in 2025 waited 61 months for its grid connection.[4]

The second number is 5 percent. That is the average GPU utilization Cast AI measured across production Kubernetes clusters between January 2025 and April 2026, a study that covered tens of thousands of them,[5] and it is measured telemetry rather than a survey. The more generous academic traces land near half, although even they describe fleets split between saturated and stranded, rarely in between.[6]

Sold out. Ninety-five percent idle. Same industry, same year.

An airline cannot sell every seat and still fly empty. Compute can, because the seat is not sold per flight but leased for the season. Capacity is bought as undifferentiated, always-on reservations sized to a peak that arrives a few weeks a year, and the reservation keeps billing through every quiet Tuesday in between. The waste lives in the shape of the contract rather than in the silicon.

Utilization figures disagree because of what each one counts. Fleet telemetry says 5 percent, whereas job-level traces say about 50. Both are correct within their scope, and neither rescues the buyer, because both point the same way: enterprises are paying for capacity shaped nothing like their demand.

Here is why: an enterprise's AI workloads come in two kinds. The first is the daily baseline: the chat assistant, the copilot traffic, the embedding pipeline that hums at the same rate on Saturday as on Tuesday. The second pile is everything outside the baseline. For example, the quarterly eval suite, the re-index after a document migration, the fine-tune, and the agentic coding rollout that went from 32 percent to 84 percent of Uber's engineers in a single month and burned the company's 2026 AI budget in four.[7] Flexera's 2026 State of the Cloud report found wasted cloud spend rising to 29 percent, the first increase in five years, and pointed at surging AI workloads as the cause.[8] The burst, in particular, is where the money leaks.

The baseline is easy to buy because you reserve it and move on. The second pile is where the capacity crisis actually bites. It arrives unscheduled and does not fit the reservation, and the market's answer is a waitlist or an on-demand rate quoted on the assumption that you have no choice.

This post prices that problem end to end. Every figure is dated and sourced, because undated numbers are how this industry talks itself into bad contracts. I will first give you a way to separate baseline from burst, and then explain what we built in response: a directory of 2,965 open-weight models with full spec cards at [savrn.com/models](https://savrn.com/models), and dedicated capacity scoped to a workload envelope instead of a calendar. The directory exists because the placement decision starts with the model, not the rack.

<div class="statband"><div class="stat"><div class="n">1.4%</div><div class="l">Record-low vacancy across North America&#x27;s eight primary data center markets</div><div class="src">CBRE, year-end 2025</div></div><div class="stat"><div class="n">5%</div><div class="l">Average GPU utilization across production Kubernetes clusters</div><div class="src">Cast AI, Jan 2025 to Apr 2026</div></div><div class="stat"><div class="n">61 months</div><div class="l">Median wait from interconnection request to operation for US power projects</div><div class="src">LBNL, 2025</div></div></div>

<div class="statband"><div class="stat"><div class="n">280x</div><div class="l">Drop in the price of GPT-3.5-class tokens, Nov 2022 to Oct 2024</div><div class="src">Stanford HAI, 2025 AI Index</div></div><div class="stat"><div class="n">2/3</div><div class="l">Share of all AI compute that is inference in 2026</div><div class="src">Deloitte, TMT Predictions 2026</div></div><div class="stat"><div class="n">123x</div><div class="l">Spread between the serving cost and the list price of a million tokens</div><div class="src">SAVRN, August 28, 2026</div></div></div>

The first step is knowing which pile a workload belongs to, and that is where we begin.

## 1. The Workloads Nobody Budgeted

Consider one number first: 300 milliseconds.

That was the latency target for Amazon's Rufus shopping assistant during Prime Day 2024, while it answered millions of queries per minute.[9] AWS later disclosed that the fleet behind it ran on more than 80,000 Trainium and Inferentia chips, processing about 3 million tokens a minute at peak.[9] Eighty thousand accelerators is roughly the silicon footprint of a respectable cloud region, mobilized for a shopping event, and almost none of that load existed in anyone's capacity plan three years earlier. It arrived on top of the baseline, on a calendar, with a hard latency floor, while the storefront that paid for it could not be allowed to starve.

That is the second pile, and every enterprise running AI in production now has one: inference demand that sits outside the daily baseline the machines were bought to serve. When I walk a CIO through their token logs, the pile sorts into five kinds of work. In fact, none of them were in the budget deck.

### The taxonomy of outside-the-baseline work

**Batch and deferrable.** The providers admit this category is enormous, since OpenAI, Anthropic, and Google all price asynchronous batch work at 50 percent of standard rates for 24-hour turnaround.[10] Half price is the market conceding that a large share of enterprise inference does not need to happen now. Think of nightly churn scoring across every customer, or document pipelines classifying and extracting from queues of files. Think of embedding builds and re-indexes: change your embedding model and a full re-index follows, and teams typically trigger one to three of them in their first six months.[11] Then there is synthetic data. Gartner said in 2023 that more than 60 percent of the data used to train AI would be synthetic by 2024.[12] NVIDIA, for example, released Nemotron-CC-v2 in August 2025, a 6.6-trillion-token pretraining corpus with large synthetic subsets,[13] and somebody's GPUs produced those tokens, in bursts.

**Episodic spikes.** Rufus is the loudest example, although it is not the only one. For example, Salesforce's holiday data shows AI and agents influencing 20 percent of all 2025 holiday retail sales, $262 billion of $1.29 trillion in global spend, while shoppers used retailers' AI customer service 126 percent more during the holiday rush than in the two months prior.[14] "Influenced" means recommendations and referrals touched the sale rather than a model closing it, but the inference spike behind that influence was real either way. Intuit's AI tax stack runs inside a filing season where accounting workloads run two to three times baseline, January through April.[15, 16] These spikes stay predictable in aggregate while remaining unplannable in detail, which is the worst combination for a procurement cycle.

**Evaluation and red-teaming.** Before any model touches your customers, you pay to interrogate it. The EvalEval Coalition, hosted by Hugging Face with the University of Edinburgh and EleutherAI, has documented evaluation as a compute bottleneck.[17] Coverage of its work puts a comprehensive evaluation suite at roughly $50,000 in API tokens and evaluation overall at 10 to 20 percent of frontier compute budgets.[17] One run of the Holistic Agent Leaderboard costs about $40,000 across 21,730 agent rollouts.[17] Evals recur with every model upgrade, every prompt change, and every drift alarm, while nobody's CFO approved a line item called "repeatedly paying to check the machine."

**Fine-tuning and distillation bursts.** Checkr fine-tuned an open 8-billion-parameter model that beat GPT-4 on adjudication, 88 to 97 percent accuracy on standard cases, at 0.5-second latency while using a fraction of the inference cost.[18] In its LoRA Land experiment, Predibase trained 25 task-specific Mistral-7B adapters that rival or beat GPT-4 on their tasks by 4 to 15 percent, at under $8 of training each on average.[19] Those results date from 2024, and training has only gotten cheaper since. The pattern holds: ultimately you end up with a stable of small, sharp models, each one a concentrated training burst followed by a new permanent resident in the inference fleet.

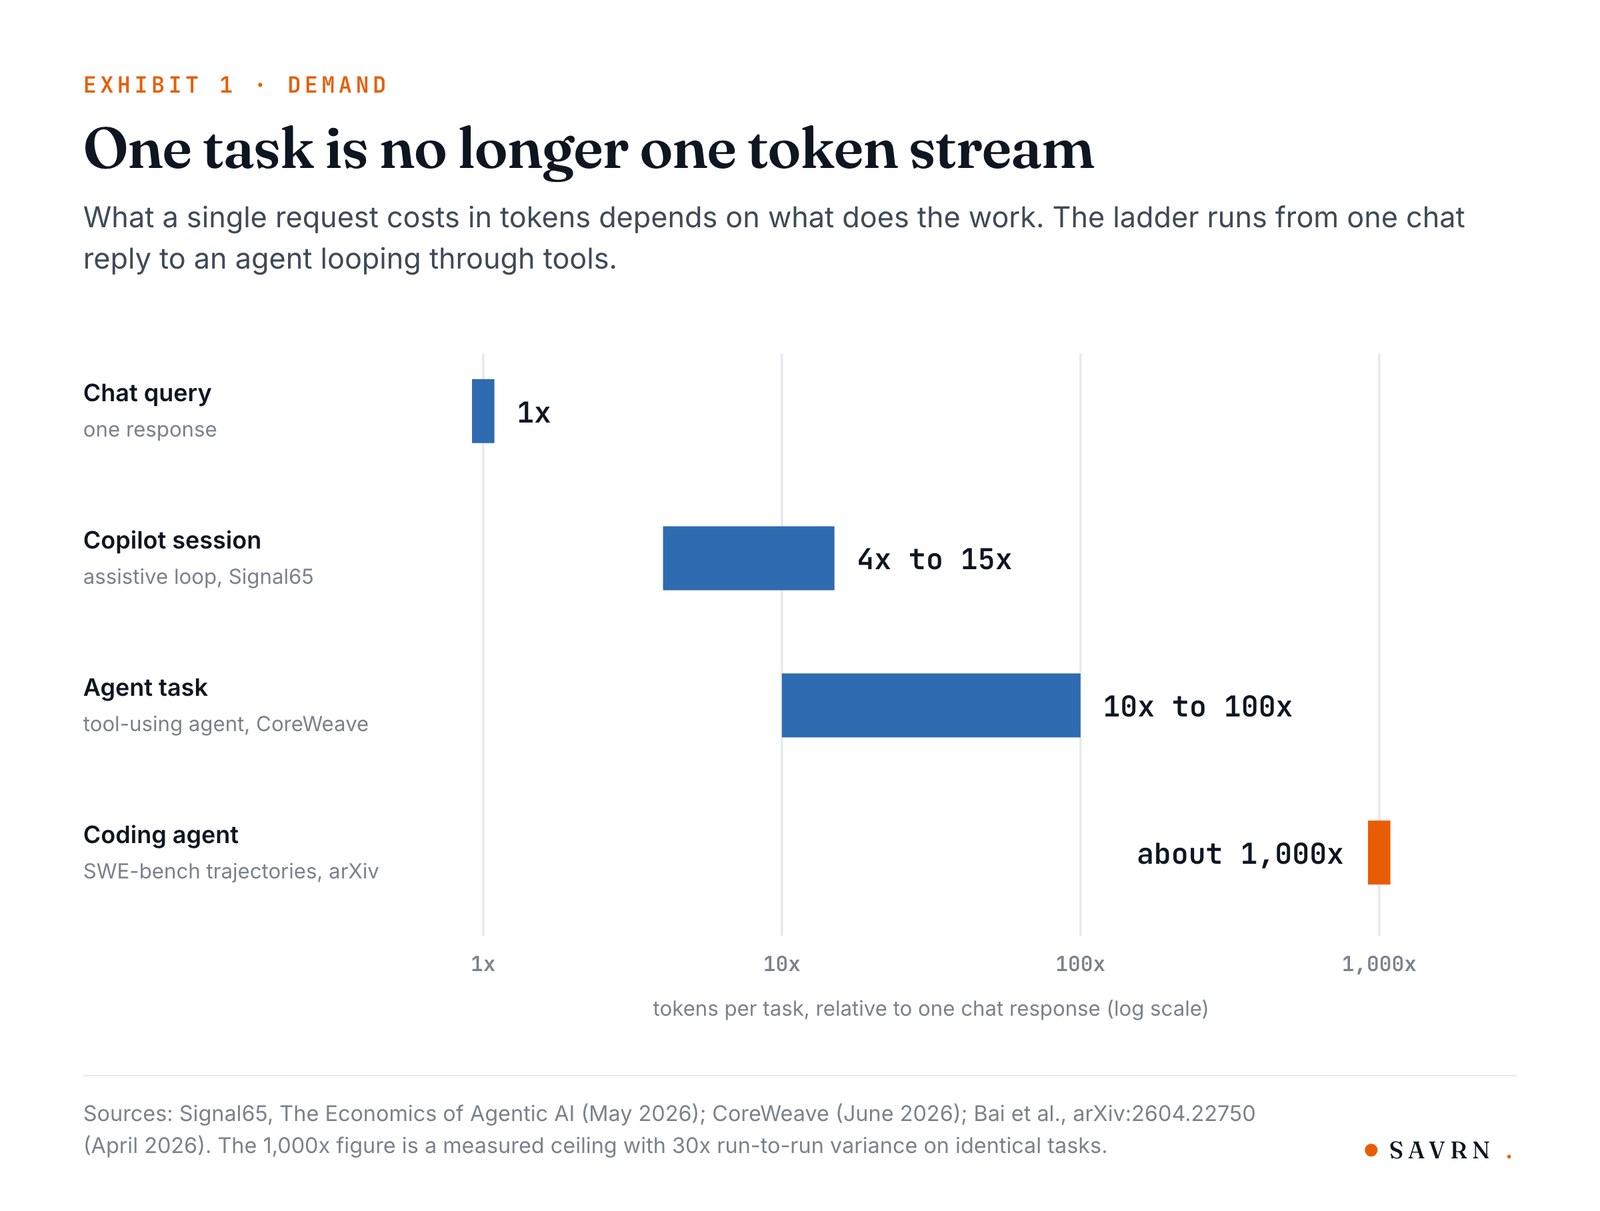
**Agentic multiplication.** This is the multiplier on everything above. Signal65's analysis for Dell's AI Factory finds agentic workloads consuming 4 to 15 times more tokens than standard chat, and autonomous agents driving up to 1,000 times more inference demand than reasoning AI.[20] CoreWeave's engineers observe a single agent task generating 10 to 100 times the tokens of a normal query.[21] An April 2026 arXiv study of coding agents measured agentic tasks consuming about 1,000 times more tokens than code chat, with input tokens doing the damage.[22] Finally, OpenAI's own enterprise report shows reasoning-token consumption per organization up roughly 320-fold in twelve months.[23]

<figure class="bfig"><img src="/media/blog-ai-inference-capacity-ex1-agentic-multiplier-20260919.jpg" alt="Bar chart of tokens per task relative to one chat response: copilot 4x to 15x, agent task 10x to 100x, coding agent about 1,000x." loading="lazy"><figcaption>Exhibit 1. What one task costs in tokens, from a chat reply to a coding agent.</figcaption></figure>

Read the chart top to bottom, since it is a story about what "one request" now means. Chat was one call, while a copilot turn is a handful of calls wrapped around a human. An agent, by contrast, is a loop that plans, calls tools, reflects, and retries, re-reading its accumulated context on every step. The 1,000x bar carries an asterisk, because it is a measured ceiling from agentic coding trajectories, and the same study found 30x run-to-run variance on identical tasks. Therefore the conservative reading is not 1,000x. It is that your cost model's unit changed from "per prompt" to "per task," while nobody repriced the budget when it did. Even the mid-range bars mean a workload that looked cheap in the pilot arrives in production at a different order of magnitude.

### Why these workloads break capacity plans

Look at what the five categories share. Every one is spiky, deferrable, or both. Each is the opposite of the baseline it must not disturb.

The baseline is Rufus at 300 milliseconds, the copilot your engineers expect to answer in under a second, and the fraud scorer in the payment path. It is latency-bound, diurnal, and politically untouchable, because the day the storefront slows down is the day your AI program gets a new executive sponsor. The second pile behaves nothing like it. Batch work wants cheap overnight throughput, while spikes want surge headroom that sits idle 51 weeks a year. Evals want a weekend of frontier-model tokens before launch, whereas fine-tunes want a rack for three days, then nothing.

Annual capacity plans cannot absorb this gracefully, because these workloads arrive on triggers the planner does not control: a retail calendar, a tax deadline, an embedding-model upgrade, an incident at 2 a.m. Teams therefore do the rational thing and hoard. They over-reserve against the peak, which is how you get sold-out capacity coexisting with single-digit utilization, while paying on-demand premiums when the surge exceeds the hoard.

There is a better shape for the problem, but before we get to the shape, we have to answer the question every board asks first: how big is this market, really?

## 2. The Market That Ate the Budget

### The macro numbers

Two point seven trillion dollars is where I start, since that is Gartner's forecast for worldwide AI spending in 2026, up in a single year by 49.5 percent. The largest single line item inside it is not software or services but rather infrastructure: the servers, the semiconductors, the network fabric, the machine that serves the models.[24]

The capital side is just as lopsided. McKinsey estimates that data centers will absorb $6.7 trillion in cumulative capital expenditure by 2030, and specifically $5.2 trillion of that goes to AI-capable facilities while everything else gets $1.5 trillion.[25] One caution before anyone quotes that number back to me, because it gets misquoted constantly: $6.7 trillion is cumulative 2025 to 2030 capex including buildings and power, rather than an annual market size. It is also a mid-case, because in McKinsey's own scenarios the constrained case is $3.7 trillion while the accelerated one is $7.9 trillion.[25]

On the ground, the build is already breaking records. IDC put worldwide AI-infrastructure spending at $86 billion in Q3 2025 alone, a record quarter, while projecting full-year 2025 at $334 billion and more than $902 billion by 2029.[26]

Now the enterprise actuals, which matter more to me than any forecast. Menlo Ventures counts $37 billion in enterprise generative-AI spending in 2025. That is 3.2 times the 2024 figure of $11.5 billion and more than twenty times the 2023 figure of $1.7 billion.[27] In particular, $12.5 billion of that went straight to foundation-model APIs. And 76 percent of enterprise AI use cases were purchased in 2025, up from 53 percent the year before.[27] Enterprises are buying capacity, and more of it every quarter, rather than standing up their own model-serving empires.

The fastest-growing software category in history is one where three-quarters of buyers decided to rent rather than own.

### Inference becomes the workload

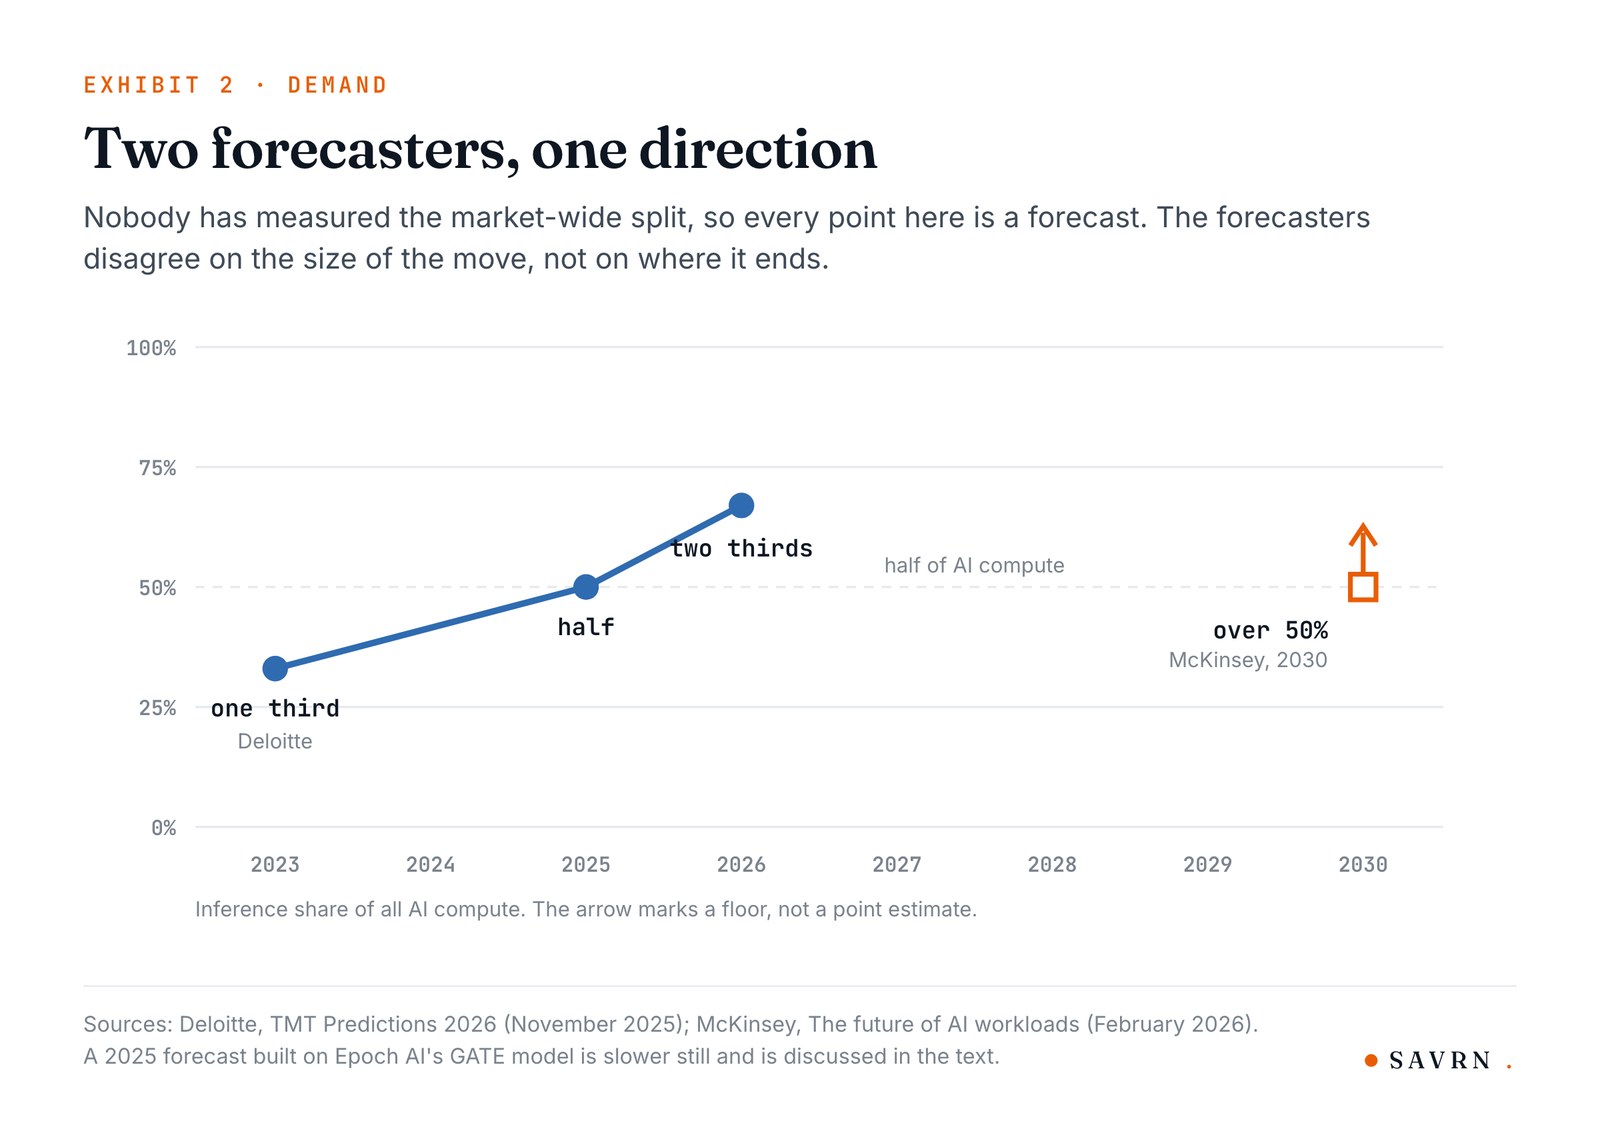
One organizing number: two-thirds. Deloitte's TMT Predictions 2026, published November 18, 2025, puts inference at roughly two-thirds of all AI compute in 2026, up from a third in 2023 and half in 2025.[28] Training built the models, while running them is eating the budget.

McKinsey is more conservative, although it expects inference to cross half of all AI data-center compute by 2030, representing 30 to 40 percent of total data-center demand.[29]

Every figure here is a forecast, since nobody has measured the market-wide split, and the estimates disagree. For example, a 2025 forecasting paper that draws on Epoch AI's GATE model shows training at roughly 90 percent of compute in 2024 and 2025, easing to 70 percent between 2026 and 2028, a much slower transition than Deloitte's.[30] The direction is unanimous. The magnitude is not. When someone quotes you an inference-share number without a date and a source attached, treat it as a pitch rather than a plan.

<figure class="bfig"><img src="/media/blog-ai-inference-capacity-ex2-inference-share-20260919.jpg" alt="Line chart of inference share of AI compute: Deloitte one third in 2023, half in 2025, two thirds in 2026, and McKinsey over half by 2030." loading="lazy"><figcaption>Exhibit 2. Two forecasters, one direction: inference takes the majority of AI compute.</figcaption></figure>

The exhibit tells one story in two voices. Deloitte draws the steep curve, a doubling of inference's share in three years, while McKinsey flattens the slope but confirms the destination: by 2030, the majority of the machine's work is serving tokens, not training them. The spread is the useful part, because anyone planning capacity on a single estimate is planning on a guess. The planning-relevant fact is that every forecast points the same direction, and in fact even the slowest one means inference more than doubles its share of the world's AI compute within this decade.

### How big is "inference," actually

This is where most market-sizing articles mislead you, usually by omission, because "the AI inference market" is not one market. The analysts counted different things, so the 2025 estimates differ by a factor of six or more:

- **Narrow: inference-as-a-service.** Metered API and hosted endpoints come to $18.6 billion in 2025 and grow to $197.5 billion by 2035 at a 26.8 percent CAGR, per Precedence Research. The US slice runs from $5.58 billion in 2025 to roughly $60.4 billion by 2035.[31]
- **Broad: the full inference market including hardware and edge devices.** Estimates for 2025 are $103.7 billion (Fortune Business Insights), $106.0 billion (Polaris), and $125.8 billion (Research and Markets), while they converge on $313 to $537 billion by 2034 or 2035 at CAGRs between 13 and 19.4 percent.[32, 33, 34]

Same year, same label, and a spread of roughly six to seven times, because the narrow definition counts only the metered service layer while the broad ones fold in every GPU, ASIC, and edge device that ever runs a forward pass. Both are legitimate, although neither is interchangeable, and blending them is how you get a slide that says "inference is a $500 billion market" next to a revenue plan that assumes it is a $20 billion one.

For planning, I use the narrow number, since the market a capacity provider can touch this year is the inference-as-a-service figure of $18.6 billion, while the ten-year prize, if the Deloitte crossover holds, is the endpoint of $197.5 billion. One more detail worth knowing: because Menlo excluded inference and model-serving spend that earlier editions had counted, it restated its own historical enterprise figures downward in its 2025 edition, so 2023 now stands at $1.7 billion and 2024 at $11.5 billion.[27] A meaningful chunk of what was once counted as "enterprise GenAI" was inference infrastructure all along, and the second pile was always there. It just used to hide inside the first.

The budget moved from training to running, while the enterprises moved from building to buying, and the market is big at every scope you measure it, provided you say which scope you are using. What it costs to run that market efficiently is the next question, because that is where the deflation math gets interesting.

## 3. The Economics of the Second Pile

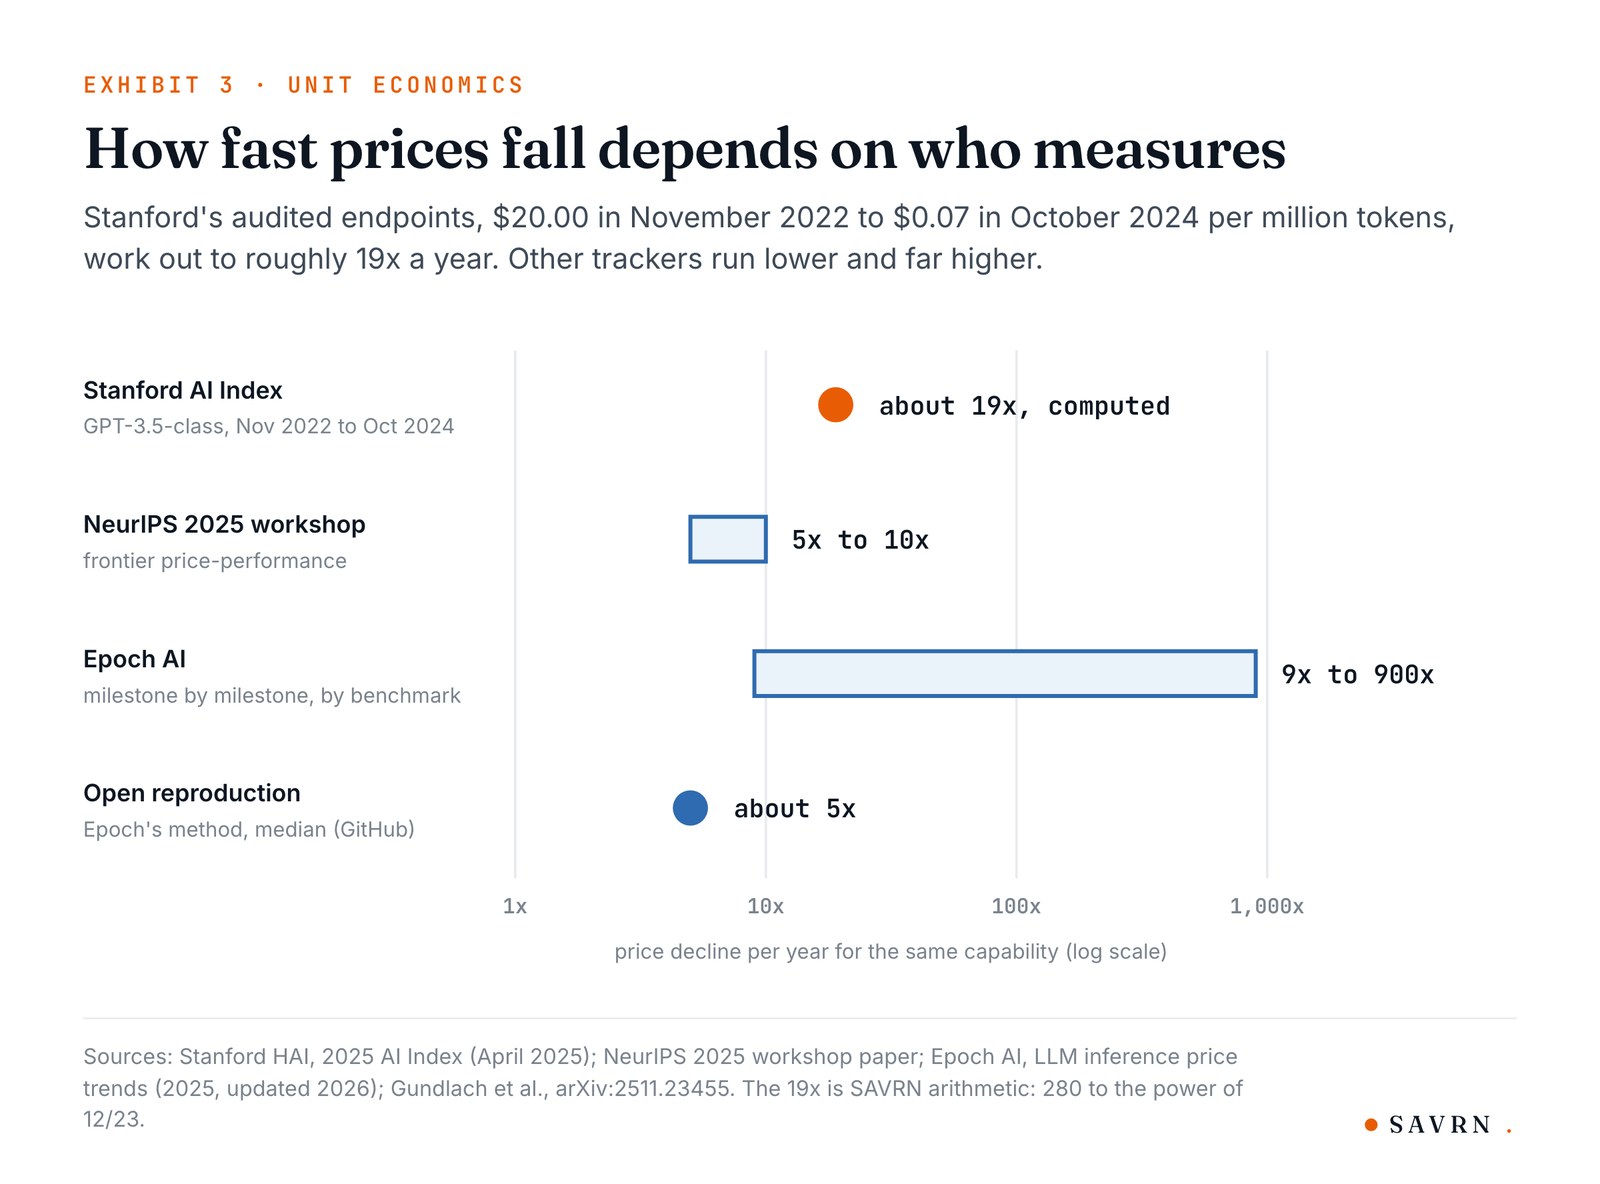
**Two hundred and eighty to one.** That is the collapse in the price of a million GPT-3.5-class tokens between November 2022 and October 2024: $20.00 down to $0.07, per Stanford's 2025 AI Index.[35] Picture your morning coffee going from twenty bucks to seven cents in under two years, and the coffee improving while it got cheaper.

Now hold that number next to a second one. Enterprise generative AI spend went from $1.7 billion in 2023 to $37 billion in 2025, per Menlo Ventures, while prices were in freefall over that exact window.[27] Cheaper tokens, bigger bills: that pairing is not a paradox, because it is the whole economics of the second pile.

### Deflation: tokens get cheaper, bills get bigger

The deflation curve comes with error bars, because Stanford's figure is the audited anchor but the annual rate depends on who measures and what they count. First, a NeurIPS 2025 workshop paper puts price declines for models on the cost-performance frontier at 5x to 10x per year, with roughly 3x of that from algorithmic efficiency alone.[36] Epoch AI's milestone-by-milestone series is, by contrast, far more aggressive, ranging from 9x to 900x per year depending on the benchmark.[37] A 2026 open reproduction of Epoch's method, however, found a median of about 5x per year.[38] I will not blend these into a tidy point estimate, because the disagreement is the finding, and even the most conservative reproduction halves your per-token cost roughly every five months.

Underneath the models, the machine that serves them keeps improving too. Stanford pegs ML hardware cost declines at about 30 percent annually, while energy efficiency improves about 40 percent per year.[35] NVIDIA reports that SemiAnalysis's InferenceX benchmarks show the GB300 NVL72 delivering up to 35 times lower cost per token and up to 50 times higher throughput per megawatt than Hopper.[39] Those are vendor-published "up to" figures, and InferenceX's own page prices a DeepSeek-R1 workload on the GB300 at about $0.12 per million tokens.[39] In MLPerf Inference v6.0, NVIDIA showed up to 2.7 times more DeepSeek-R1 throughput on the same Blackwell Ultra racks than six months earlier, which it credits to software updates.[40] Hardware that gets faster after you bolt it down is a strange asset, because any capacity contract you sign today is priced against a moving target.

<figure class="bfig"><img src="/media/blog-ai-inference-capacity-ex3-deflation-20260919.jpg" alt="Range chart of annual price decline for the same AI capability: Stanford about 19x, NeurIPS workshop paper 5x to 10x, Epoch AI 9x to 900x, open reproduction about 5x." loading="lazy"><figcaption>Exhibit 3. How fast token prices fall depends on who measures.</figcaption></figure>

The chart's message is that the price of a token is falling structurally rather than cyclically, and that nobody agrees on how fast. Since silicon improves about 30 percent a year and algorithms about 3x a year, and competition passes most of both through to list prices, the practical reading for a CFO is this: any inference budget built on today's per-token price is wrong within two quarters, and wrong in a specific direction. The unit price comes in lower than you modeled while the total bill comes in higher. Capability that cost $60 per million tokens in 2021 costs six cents by late 2024,[41] and in fact nothing in this data says the slope has to flatten.

### Jevons, observed in one company's disclosures

Economists argue about whether Jevons paradox applies to compute, while Google put numbers on it. Monthly token processing went from 9.7 trillion in May 2024 to 480 trillion in May 2025 to 3.2 quadrillion by May 2026, roughly 330 times in two years, while the energy used by its median prompt fell by a factor of 33.[42] Thus volume outran efficiency by an order of magnitude.

On January 27, 2025, the day DeepSeek knocked a trillion dollars off tech market caps, Satya Nadella posted: "Jevons paradox strikes again! As AI gets more efficient and accessible, we will see its use skyrocket, turning it into a commodity we just can't get enough of."[43] The receipts arrived fast: for example, OpenAI's enterprise data shows reasoning-token consumption per organization up roughly 320-fold in twelve months.[23] Meanwhile, documents reported by Ed Zitron, said to be leaked from Microsoft, put OpenAI's inference spend at $8.67 billion through the third quarter of 2025 against about $4.33 billion of implied revenue.[44] Take that as reporting rather than audited fact. It still points at the same thing: two dollars of inference for every dollar coming in.

Deflation moves the constraint rather than shrinking anyone's bill. While tokens are nearly free, the scarce thing is the capacity to serve your peak, on your latency budget, on the day your traffic triples. Which brings me to the trap.

### The utilization trap

**Twenty-seven percent.** That is the average device compute utilization measured over a full week of production traffic, specifically on a Meta ads inference service running on H100s.[45] SM utilization averaged 14 percent, while memory capacity held flat at 28 percent. For every silicon dollar one of the best engineering organizations in the world spent on that service, seventy-three cents sat idle. Picture a trucking company that pays for a hundred trucks while sending seventy-three out empty, every day, forever, and calling it normal. In inference, it is normal.

### Why well-run fleets idle

First, the denominator problem. Reported utilization runs from 5 percent to 52 percent because it depends on what you count. The Cast AI telemetry from the introduction marks the floor, because it counts every provisioned GPU-hour whether allocated or not, while Microsoft's Philly trace marks the ceiling by counting only GPUs already assigned to work.[5, 6] Meta's 27 percent sits in the middle, and it is my anchor because it is a published production measurement on hardware that was fully allocated and revenue-critical.

The causes are structural rather than sloppy. Because traffic is diurnal, the fleet idles at night. Latency targets force small batches, which prevent saturation even under heavy load, while models stay pinned in GPU memory to meet those targets, which is why Meta's memory capacity sat flat at 28 percent all week.[45] The paper behind that measurement proposes an operating-system-level scheduler to reclaim the slack, which tells you the waste is real while the fix is not simple.

Meanwhile the peaks keep coming, and GMI Cloud's capacity-planning guidance works from peaks of 5 to 10 times average load, such as product launches, business hours, and viral moments.[46] Runway's production traffic, for example, peaks 8:30 a.m. to 12:30 p.m. Eastern on weekdays, and it built a controller to shift idle GPUs to research overnight, because reallocation takes 20 to 60 minutes.[47]

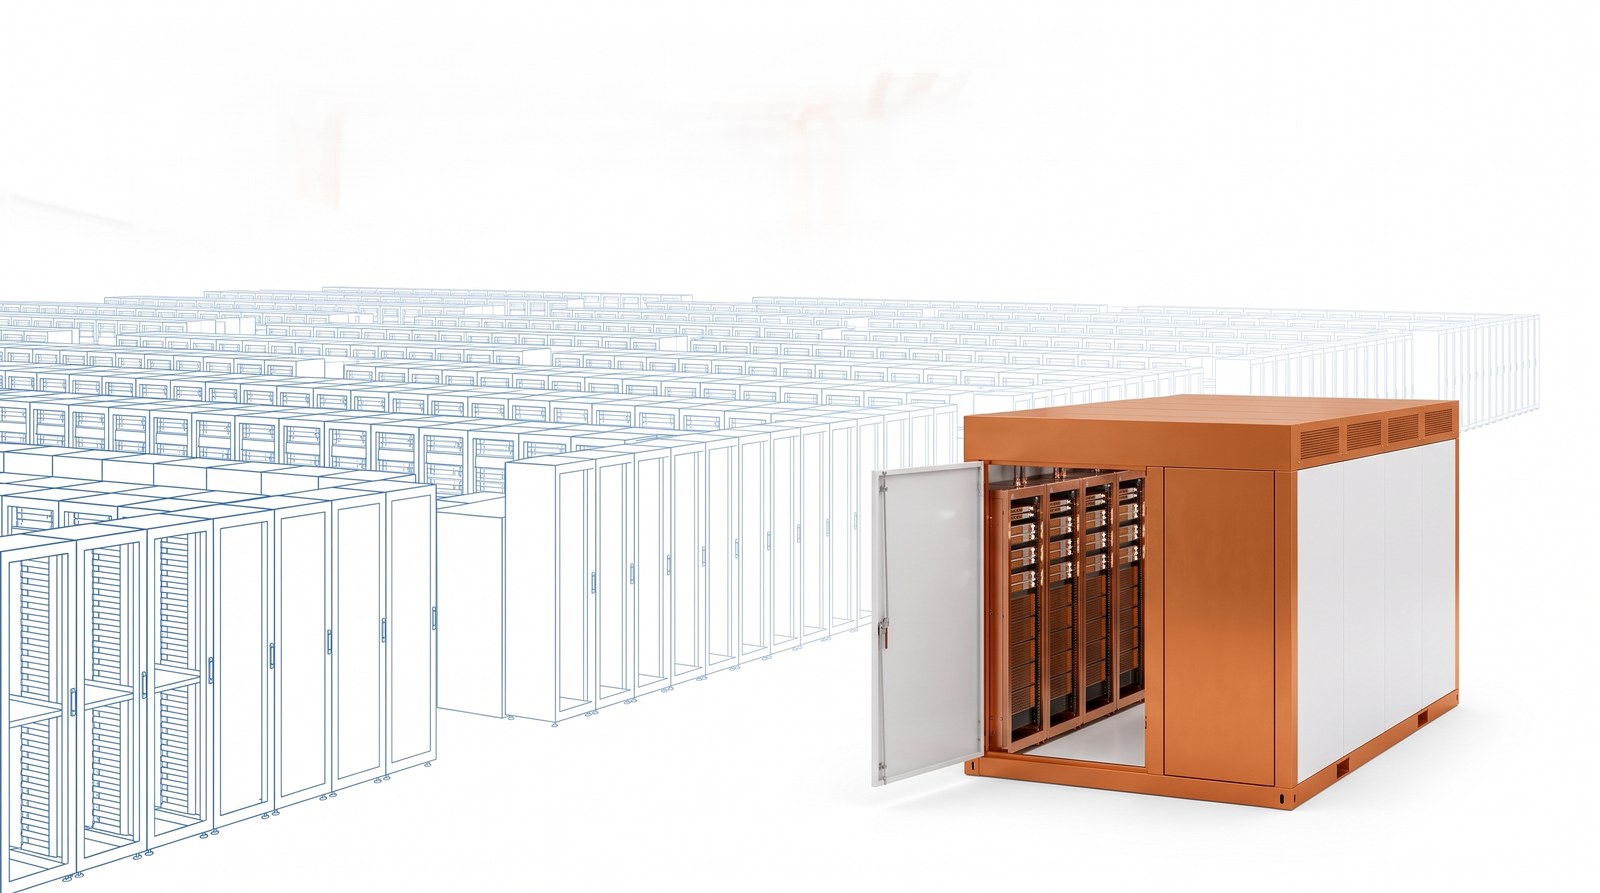
<figure class="bfig"><img src="/media/blog-ai-inference-capacity-art-sized-to-peak-20260919.jpg" alt="A compact copper compute block in front of a vast faded blueprint hall of empty racks, illustrating capacity sized to the peak." loading="lazy"><figcaption>Capacity sized to the peak is a hall you pay for all day. Capacity sized to the workload is a block that stays busy.</figcaption></figure>

### The arithmetic of sizing to peak

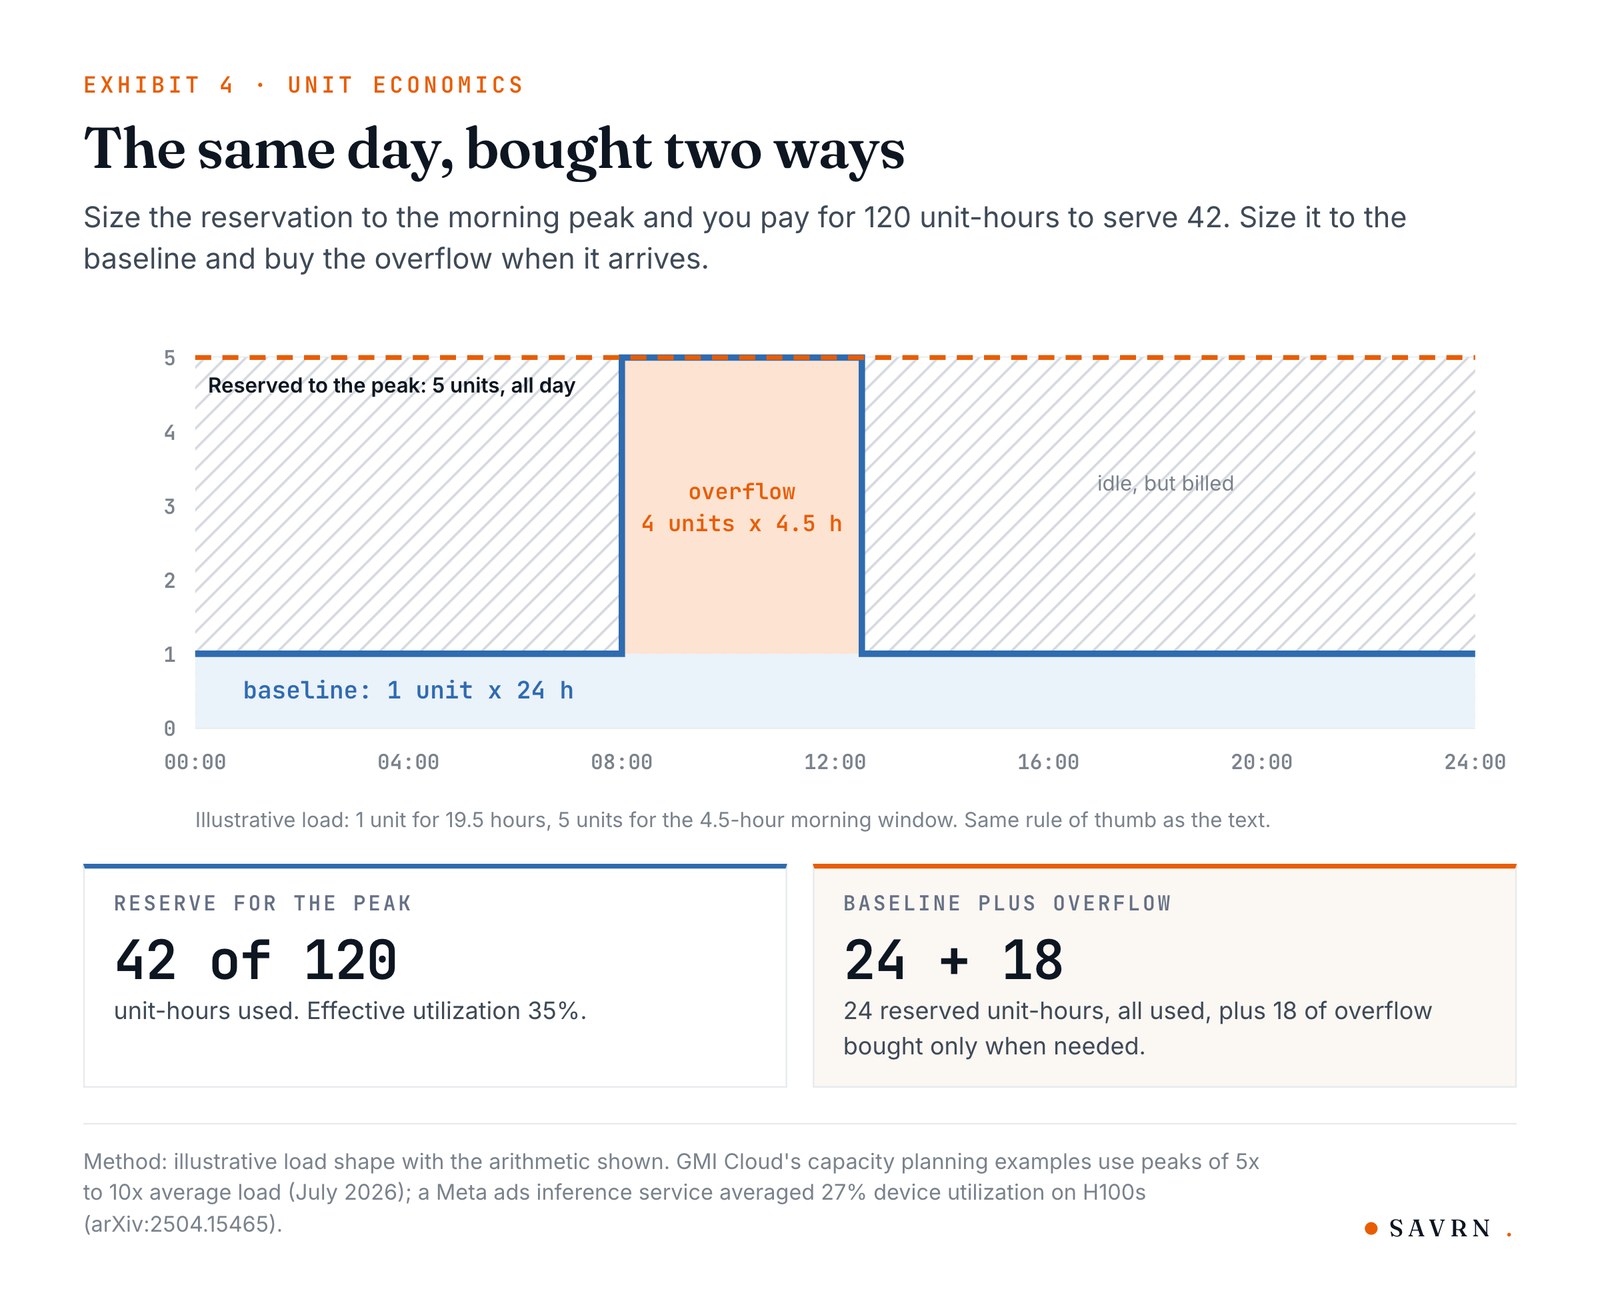
Here is the trap in one line of math: provision for a 5x peak and run at average the rest of the day, and effective utilization lands near 35 percent. The other 65 percent of spend buys idle hours, because reserved GPU hours bill identically whether the silicon is busy or dark.[48] One-year reservations discount 37 to 41 percent off on-demand at the hyperscalers, which sounds attractive until you run the breakeven. At a 40 percent discount, the commitment pays for itself only once the hardware is busy more than about 14 hours of every 24.[49] The implied breakeven runs roughly 59 to 63 percent utilization depending on provider, and up to about 80 percent at some neoclouds,[50] while owning outright shifts the threshold to roughly 55 to 65 percent sustained over three years, per PromptQuorum's TCO modeling.[51]

Few enterprise workloads sustain that. One performance-engineering guide puts autoscaling between average and peak at 40 to 60 percent cheaper than provisioning to peak.[52] The waste is visible at macro scale too: the Flexera 29 percent print from the introduction, the first increase in five years, came with Flexera's note that AI workloads are surging.[8]

<figure class="bfig"><img src="/media/blog-ai-inference-capacity-ex4-two-ways-to-buy-20260919.jpg" alt="Step chart of a daily load with a five-unit morning peak, showing 42 of 120 reserved unit-hours used when sized to peak versus 24 reserved plus 18 overflow when sized to baseline." loading="lazy"><figcaption>Exhibit 4. The same day, bought two ways.</figcaption></figure>

The hatched region is the whole argument, because a flat peak-provisioned line guarantees your latency target and wastes roughly two-thirds of the day's spend. The gap between that line and the load is money converted directly into idle silicon, while the alternative reserves a baseline near median sustained load and buys overflow capacity that exists before the peak arrives, so it absorbs the morning surge without queuing. The chart deliberately omits your real curve, because every enterprise's diurnal shape differs, which is why a fleet sized by rule of thumb sits short at 10 a.m. while sitting over-provisioned at 3 a.m. The peak-to-average ratio sets the size of the hatched region, and therefore the size of the prize for whoever shapes capacity to the load.

### The penalty for guessing low

Sizing to average instead of peak is not the answer either. When demand exceeds provisioned capacity, the excess does not disappear but instead queues. Peak-hour queue waits add anywhere from nothing to more than two seconds to API responses before the model starts generating,[53] and response times above three seconds cause measurable drop-off.[53] Voice AI is the least forgiving surface, since abandonment spikes more than 40 percent once response delay crosses one second, and each added second cuts satisfaction 15 to 20 percent.[54] PwC puts the stakes plainly: 33 percent of consumers switch brands after a single bad experience.[54]

The buyer therefore faces a two-sided penalty. If you provision to peak, you waste 40 to 60 percent of spend on idle hours, whereas if you provision to average, you pay in queued requests, abandoned sessions, and churned customers at the moments your product matters most. The first pile, the predictable daily baseline, belongs on committed capacity. The second pile, everything above the baseline, needs a different instrument: capacity scoped to the workload, warm before the peak, billed for what it serves.

The unit economics make the case, although what they cannot tell you is whether the physical world has the electrons and the racks to deliver when you call. That is a supply question, and it is where we go next.

## 4. The Wall

Sixty-one months.

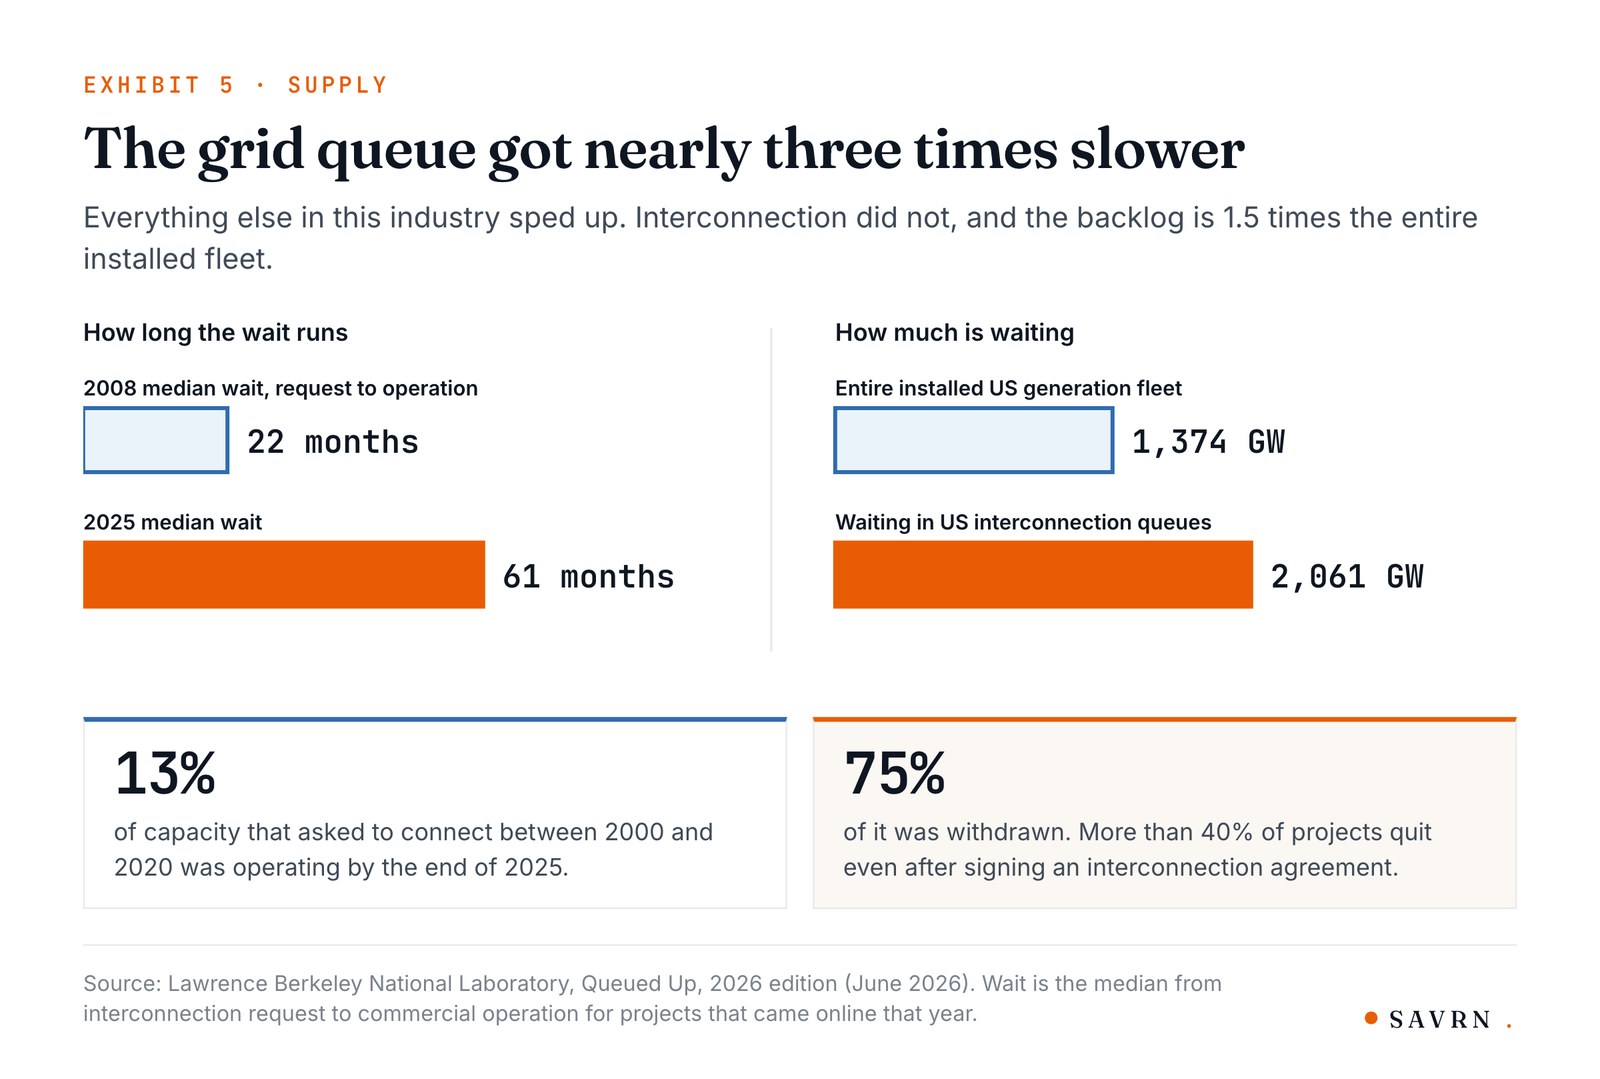
That is the median time a US power project spent between its interconnection request and commercial operation in 2025, per Lawrence Berkeley National Laboratory's *Queued Up* 2026 edition.[4] In 2008, by contrast, the wait was 22 months. Because the median project that came online last year filed its grid paperwork in early 2020, when GPT-3 was the frontier and "inference" was not yet a line item in anyone's budget, an enterprise that decides today it needs more capacity near power is, on the median, making a 2031 decision.

The obvious rejoinder is that the queue is enormous, and therefore something will get built. It is enormous, since at the end of 2025, 2,061 GW of generation and storage sat actively seeking US interconnection, roughly 1.5 times the entire installed American power fleet of 1,374 GW.[4] The queue, however, is an attrition filter rather than a pipeline. Of all capacity that requested interconnection between 2000 and 2020, only 13 percent had reached commercial operation by the end of 2025, while seventy-five percent was withdrawn and more than 40 percent of projects quit even after signing an interconnection agreement.[4] A gigawatt in the queue is a hope rather than a receipt.

<figure class="bfig"><img src="/media/blog-ai-inference-capacity-ex5-grid-queue-20260919.jpg" alt="Bar charts from Lawrence Berkeley National Laboratory: median interconnection wait rose from 22 months in 2008 to 61 months in 2025, and 2,061 GW sits in queues against a 1,374 GW installed fleet." loading="lazy"><figcaption>Exhibit 5. The grid queue got nearly three times slower.</figcaption></figure>

In the left panel, connection waits nearly tripled over seventeen years while everything else in this industry got faster. Tokens got cheaper, models got better, chips improved. The grid did not get the memo. The right panel shows why the raw queue number fools people: the backlog exceeds the entire installed fleet, yet only about one request in eight has historically become a running plant. Both facts hold at once, which is exactly why "we will just buy more when the burst hits" fails as a plan, since the thing you are buying has a five-year fuse and a 75 percent historical withdrawal rate.

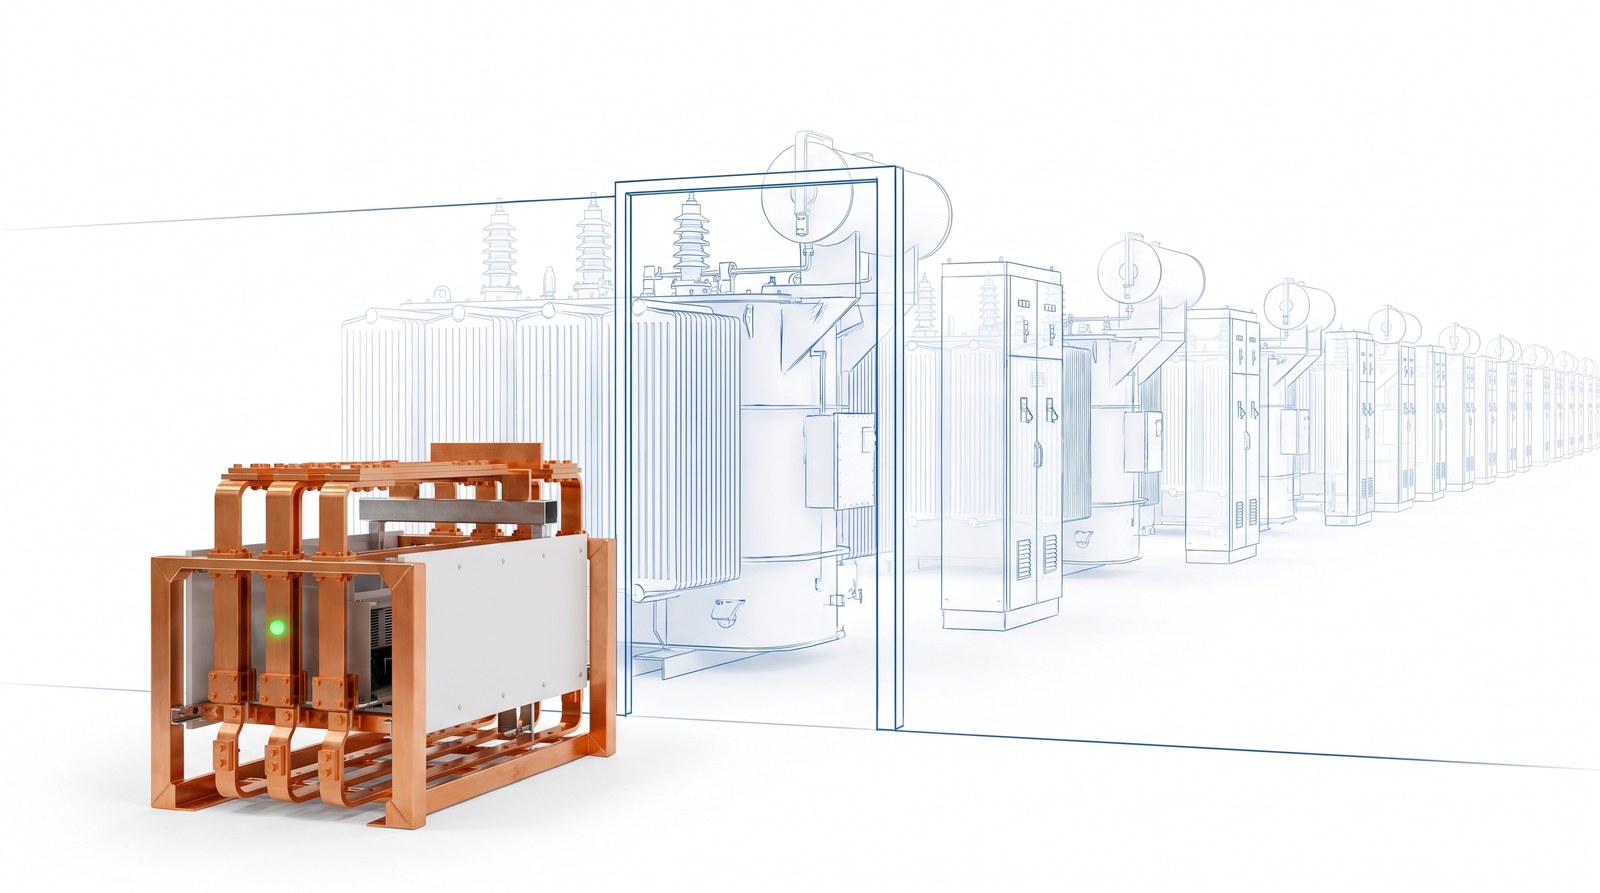
<figure class="bfig"><img src="/media/blog-ai-inference-capacity-art-grid-queue-20260919.jpg" alt="A solid copper compute block already energized beside a long faded blueprint line of transformers and switchgear waiting behind a gate." loading="lazy"><figcaption>Transformers, switchgear, and interconnection studies all wait in line. The block on site does not.</figcaption></figure>

### Power is the constraint

Start with the demand side, since in November 2025 Grid Strategies reported that US utilities' five-year peak-load growth forecast had hit 166 GW, a six-fold jump from the 24 GW forecast three years earlier, "equivalent to adding 15 times the peak load of New York City," with data centers driving roughly 55 percent of it.[55]

The skeptical reading first. Grid Strategies itself finds that utility forecasts likely overstate data-center load by about 40 percent, and accordingly it expects realistic growth closer to 60 to 65 GW through 2030.[55] Fine. Take the skeptics' number, which is still about six New York Cities of new peak load arriving in five years, while the grid takes five years to connect anything.

The consumption forecasts tell the same story at different scopes, so I will name the scopes instead of blending them. The IEA's April 2025 *Energy and AI* report projects global data-center electricity more than doubling, from about 415 TWh in 2024 to around 945 TWh by 2030, slightly more than Japan's entire consumption, whereas electricity for accelerated servers grows near 30 percent a year.[56] EPRI's *Powering Intelligence 2026* puts US data centers at 9 to 17 percent of national electricity generation by 2030, an estimate 60 percent higher than EPRI's own 2024 scenarios.[57] The forecasters disagree on how fast, although they do not disagree on which way.

Then there is the money. Jensen Huang has put the cost of one gigawatt of AI capacity at $50 to $60 billion, whereas Epoch AI's May 2026 breakdown of a typical one-gigawatt facility lands at $37.9 billion in up-front capital expenditure.[58, 59] The gap is mostly whether you count the GPUs. Either way, a gigawatt is not a purchase order, but instead a multi-year, nationally visible construction program.

### The silicon and steel queue

Every physical layer waits on the layer beneath it. For example, large power transformers now average about 128 weeks of lead time and generator step-up units about 144, up from roughly 50 weeks in 2021, per a Wood Mackenzie survey from the second quarter of 2025.[60] TSMC's CoWoS advanced packaging, the chokepoint for every top-end accelerator, is fully allocated through at least mid-2027, while hyperscaler forward orders consume most of the Blackwell-series allocation into 2027.[61] SemiAnalysis pegs Blackwell B200 order lead times at 36 to 52 weeks, eight to twelve months, even for hyperscalers.[62] SK hynix, likewise, had sold out its entire 2026 HBM, DRAM, and NAND output by October 2025.[63] Chips wait on packaging, packaging waits on memory, racks wait on transformers, and transformers, ultimately, wait on the queue.

### The buildings are full, and the neighbors are organized

Although you may have the chips and the patience, you still need a building. At the end of 2025, CBRE recorded vacancy across North America's eight primary markets at a record low of 1.4 percent.[1] JLL found 73 percent of capacity under construction already preleased in its midyear 2025 report, while Cushman & Wakefield counted 89 percent of Americas development pre-committed before delivery.[64, 65] Tenants are signing for 2028 deliveries today.

The last constraint is political. Data Center Watch counted $130 billion in US project value blocked or delayed in the first quarter of 2026, matching all of 2025 in three months, alongside 833 active opposition groups and 69 or more local governments with formal bans. Ipsos polling, in addition, shows 70 percent of Americans would oppose a data center near their neighborhood.[66] On July 7, 2026, Prince William County, Virginia, part of the largest data-center hub in the country, voted unanimously to withhold approval of a development covering more than 1,900 acres.[67] Siting is now a community negotiation rather than a real-estate decision. That will matter later in this essay, because smaller, quieter, water-free sites near where people actually work have a very different conversation with a county board than a five-gigawatt campus does.

The wall is real, and rather than one wall it is six of them, stacked in series: grid, generation, chips, packaging, buildings, and permits. Because each has its own multi-year clock, capacity you can actually use in a burst is capacity that existed before you called, which raises the next question: who already holds it, and on what terms.

## 5. The Market With No Ticker

There is no screen you can pull up to price an hour of AI compute. Oil has Brent and electricity has ERCOT, whereas compute has hundreds of prices scattered across dozens of providers, and the only way to know the number is to call someone. As of September 13, 2026, the [SAVRN Index](https://savrn.com/ai-index) tracked 732 prices from 54 providers,[68] and I know this because we built the screen ourselves. The Index checks every one of those prices every three hours against the seller's own feed or page, and what it shows is a bazaar with a ticker-shaped hole in the middle of it rather than a market.

This section is about what that hole costs the buyer, specifically three units, one electron, and a spread wide enough to hide a data center in.

### Three units for the same electron

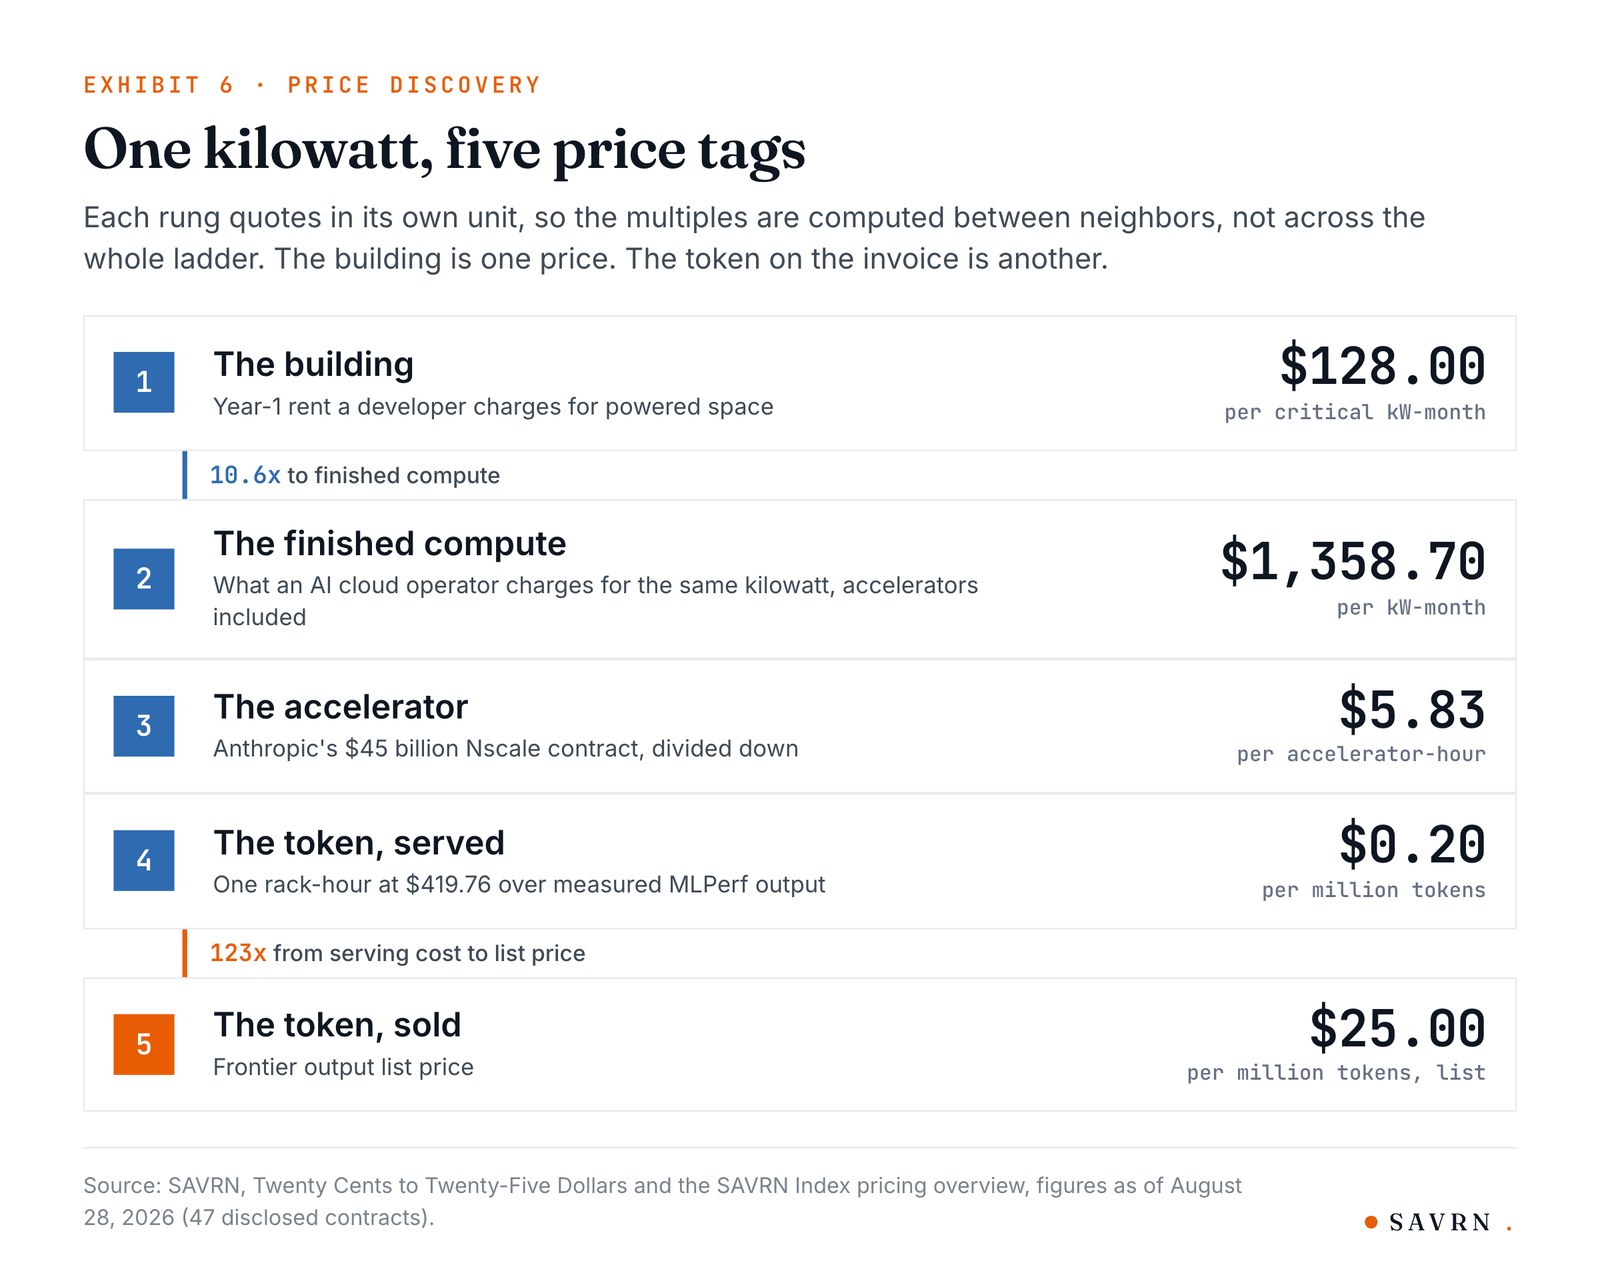
Start with one fact, which is that the same powered kilowatt is sold five different ways while each step up the ladder re-prices it. As of August 28, 2026, our pricing study reads the ladder like this.[69]

While the building rents at $128 per critical kilowatt-month, the Year-1 rate a developer charges for powered space, the finished compute inside that building, with racks up, network lit, and silicon installed, runs $1,358.70 per kilowatt-month, a 10.6x step for hanging hardware on the same power. Divide Anthropic's $45 billion Nscale contract down and the accelerator itself costs $5.83 an hour. Push that accelerator against a measured serving harness and it will, in fact, produce a million tokens for $0.20. However, the list price for a million of those tokens, at the frontier, is 123 times the serving cost, or $25.00.[69]

Because each rung quotes in its own unit, I compare only neighbors, and the full derivation is in [Twenty Cents to Twenty-Five Dollars](https://savrn.com/blog/twenty-cents-to-twenty-five-dollars).

<figure class="bfig"><img src="/media/blog-ai-inference-capacity-ex6-price-ladder-20260919.jpg" alt="Five-rung price ladder for one kilowatt: $128 per kW-month building rent, $1,358.70 finished compute, $5.83 per accelerator-hour, $0.20 per million tokens served, $25.00 per million tokens list." loading="lazy"><figcaption>Exhibit 6. One kilowatt, five price tags.</figcaption></figure>

This is the case for transparency drawn as five rows, since each row is the same underlying asset, powered, cooled, connected capacity, re-denominated as it passes from landlord to operator to seller. The 10.6x jump from building to finished compute is real value added, because the silicon is expensive. The 123x jump from serving cost to list price is instead what a scarce, un-priced market lets the top of the stack charge the bottom. When an enterprise signs a contract, it is standing on one of these rungs, although usually without knowing which.

Now take one rung, the accelerator-hour, and watch it splinter. Across the 61 H100 prices the Index held on September 13, 2026, the typical GPU-hour quote was $3.99, while the cheapest H100 hour was $1.63 on spot at Verda and the priciest on-demand hour was $12.29 at Microsoft Azure.[68] Although the hardware is nominally identical and there is no canonical price, the spread from the spot floor to the on-demand ceiling is 7.5x. Fireworks, for example, lists a dedicated H100 at $8.00 an hour.[70] One market tracker, however, puts hyperscaler reserved-listing medians roughly 3.6 times higher than marketplaces, specifically $6.11 while the marketplace figure is about $1.70.[71]

Futures are arriving, since CME Group and Silicon Data have announced cash-settled H100 and B200 rental-index futures, codes GPU1 and GPU2, with one contract equal to one GPU-month and trading planned to begin October 5, 2026, pending regulatory review.[72] That is progress, and it is also an admission: the unit the market chose to hedge is the GPU-hour rather than the token. The middle rung is becoming the reference price, while the rungs above and below it remain negotiated in the dark.

### The split market: spot deflates, committed appreciates

Here is the fact that breaks the intuition of every CFO who learned cloud economics in the last decade: prices in this market are splitting rather than simply falling.

While on-demand capacity sat effectively sold out across surveyed providers, SemiAnalysis's one-year reserved H100 rental index rose about 40 percent in five months, from $1.70 per GPU-hour in October 2025 to $2.35 in March 2026.[2] Spot prices for the same silicon, however, tell a different story: one market analysis put the decline at about 64 percent from the 2024 peak.[73] Then, on September 1, 2026, Fireworks AI raised dedicated on-demand prices 11 to 30 percent across its line: H100 and H200 to $8.00 an hour, while B200 went to $13, B300 to $15, and GB300 to $20.[70]

Cheap leftover hours sit beside expensive committed machines, and that, in fact, is the market.

The mega-contracts say the same thing with bigger numbers. For example, Anthropic agreed to pay Nscale roughly $45 billion over six years for 460 megawatts at the Monarch campus in West Virginia, which per megawatt per year comes to about $16.3 million.[74, 75] Microsoft signed Nebius through 2031, and per the Form 6-K the base value is $17.4 billion.[76] Jane Street, a trading firm buying compute to use rather than resell, reportedly committed about $13 billion over five years to Crusoe.[77] Nebius says it is negotiating deals in the range of $40 million to $50 million per megawatt, while one auction cleared 15 percent above the highest price it had ever charged for Blackwell.[78] Synergy Research Group projected in October 2025 that neocloud revenue would pass $23 billion in 2025 and reach roughly $180 billion by 2030, nearly an eightfold climb in five years,[79] although you should treat that as a projection.

Meanwhile, the hyperscalers' reserved products strand spend by design, and AWS Bedrock's Provisioned Throughput shows how: it bills Model Units hourly whether traffic arrives or not. Its own pricing example for Cohere Command runs $49.50 per Model Unit-hour with no commitment, whereas the six-month term is $23.77, and AWS says to contact your account team for pricing on other models.[80] Azure's PTUs drop from about $2 per PTU-hour on-demand to roughly $260 per PTU-month reserved, an 82 percent discount, but they still bill idle and do not guarantee capacity when you call for it.[81] Google's Vertex sells GSUs on terms from one week to one year, with throughput that varies per model and no universal conversion.[82]

The buyer's map, therefore, looks like this. Spot is cheap and unreliable, whereas reserved hyperscaler units are expensive and idle-billed. Because Bedrock Model Units are tied to a specific model and a Vertex GSU buys different throughput on different models, a swap can strand the spend. Azure's PTUs survive a model swap, but they still bill for hours you do not use. Mega-deals price the committed layer at a premium and climbing, while in a world where the token deflates every quarter, the asset that appreciates is powered capacity with a delivery date. The only protection a buyer has, ultimately, is knowing which rung of the ladder they are standing on before they sign.

## 6. The Model Layer Became a Menu

**Four months.** That is the average gap, measured by Epoch AI since January 2026, between the most capable closed models and the best open-weight models anyone can download.[83] Four months is roughly one GPU driver cycle, whereas in the GPT-4 era the gap was far wider. The frontier pulled away first, and then the open world caught the draft.

Section 5 gave capacity a price structure, and this section is about what runs on it, because the model layer quietly stopped being a moat and became a menu.

### Open weights reached parity

Per Stanford's 2025 AI Index, the open-versus-closed gap on Chatbot Arena has narrowed since January 2024, from 8.04 to 1.70 percent by February 2025, while in a single year the US-China gap on MMLU fell from 17.5 to 0.3 points.[84] Then, in August 2025, OpenAI released gpt-oss under one of the most permissive licenses in common use, Apache-2.0.[85]

The gap oscillates, however, and the Arena Elo spread between the best closed and best open model briefly touched zero in January 2025 and had widened to roughly 29 points by September 2026.[86] Both things are true at once, because the frontier is accelerating while the open pack sits close enough behind that, for most workloads, the difference is measured in benchmark points rather than business outcomes.

The longer story is the tail. Hugging Face passed two million public models this spring, and the top 200 of them, 0.01 percent of all models, take 49.6 percent of all downloads.[87] Models under one billion parameters account for about 83 percent of all-time downloads.[87] This is a mass market rather than a frontier market, made of task-specific models sitting under a thin head: embeddings, rerankers, classifiers, document parsers. Task-specific also wins at the task: the Checkr fine-tune beat GPT-4 on adjudication, for example, while Predibase's adapters rival or beat it on their tasks for under $8 of training each, on average.[19, 88]

### Spend and volume diverged

Here is the conflict, and both sides are real: Menlo Ventures' enterprise survey found open-source models fell from 19 percent to 11 percent of enterprise LLM usage in 2025 while total enterprise generative-AI spend tripled to $37 billion.[27] Meanwhile the OpenRouter and a16z study of 100 trillion routed tokens found open weights reached roughly a third of all tokens by late 2025.[89] DeepSeek alone served 14.37 trillion tokens on OpenRouter in the twelve months to November 2025.[89]

They measure different things: Menlo counts where enterprise production budgets go, while OpenRouter counts tokens. Frontier closed models take the expensive interactive traffic: the assistant, the copilot, the last production mile where nobody gets fired for buying the best. Open weights, by contrast, take the volume: batch jobs, embeddings, evaluation suites, and agent loops that burn tokens by the billion with no human watching.

That is the divergence: closed models win budgets, while open models win workloads. The volume workloads, deferrable, definable, and sized, are therefore exactly the ones an enterprise can take off the meter and place on dedicated capacity.

Licensing became a procurement criterion along the way. Qwen, DeepSeek, GLM, Kimi, and gpt-oss carry no usage caps, revenue thresholds, or geographic limits, because they ship under MIT or Apache-2.0. The Llama Community License, in contrast, caps commercial use at 700 million monthly active users, requires "Built with Llama" attribution, and excludes EU-domiciled licensees from Llama 4's multimodal rights.[90] None of the ten major model families indemnifies the deploying business against third-party IP claims. Every set of weights ships as is, without warranty.[90] For a regulated buyer, the license line on a model card now weighs as much as the benchmark line.

<figure class="bfig"><img src="/media/blog-ai-inference-capacity-art-spec-cards-20260919.jpg" alt="A wall of faded blueprint spec cards with one solid copper card lifted forward." loading="lazy"><figcaption>The model layer became a menu, and each card is a procurement document.</figcaption></figure>

### The spec card is a procurement document

That is why we built [savrn.com/models](https://savrn.com/models): a directory of 2,965 open-weight models, sorted by downloads, each rendered as a uniform spec card with license, parameter count, context length, and framework.[91] Scroll the top of the list and you see the real economy of open weights, which is workhorses rather than showpieces: sentence-transformers embedding models, BGE rerankers, BERT and T5 classics, Qwen3 vision-language models, Amazon's Chronos time-series models.

The center of gravity moved while nobody was watching. Per the ATOM Report's audit of Hugging Face downloads, Chinese open models overtook US models in cumulative downloads in late July 2025 and have led ever since, 1.15 billion to 723 million by March 2026, while Qwen alone passed Llama that September and never gave the lead back.[92] I use platform counts because they are audited, and a menu should list what is actually ordered.

The point of a uniform card is comparison, and since license, size, and context sit in the same position on every card, choosing a model starts to look like what it is: specifying a component. For example, an 8B embedding model with a 40,960-token context is a different machine requirement than a 120B reasoning model, and the capacity you buy should know the difference. The directory is the menu, while the capacity is the kitchen.

The order matters, because to pick capacity you first pick a model, and picking a model is now a procurement act with a license field, a size field, and a download count as due diligence. The next section is the framework for that act.

## 7. The Envelope: How to Buy the Second Pile

The second pile, meaning every workload outside your baseline, is not a procurement mystery. It is three classifications, one arithmetic check, and a contract with four terms, and ultimately the operators who get this right do the same boring things in the same order.

### The decision framework

**First, classify.** Every workload is one of three things: baseline, burst, or deferrable. Baseline shows up every day at roughly the same size, whereas burst has a clock: the morning peak, Prime Day, tax season. Deferrable does not care when it runs: embedding builds, eval suites, re-indexing. Cast AI's telemetry, from January 2025 to April 2026, found average GPU utilization of 5 percent,[5] while Microsoft's Philly cluster trace, at the job level, found about 52 percent.[6] The gap between 5 and 52 is classification rather than better hardware.

**Second, measure the ratio.** Track each workload's peak-to-average ratio over a couple of months, then size the baseline to the median rather than the peak, because the arithmetic is unforgiving. For example, say a workload runs at one unit of load for nineteen and a half hours and spikes to five for a four-and-a-half-hour morning window. Reserve for the peak and you have bought 120 unit-hours of capacity while serving only 42 unit-hours of demand. Effective utilization is therefore 35 percent, the same figure Section 3's example produces. That workload is a rental, full stop. Fleets sized to peak are, in fact, how you end up in the 5 percent column.

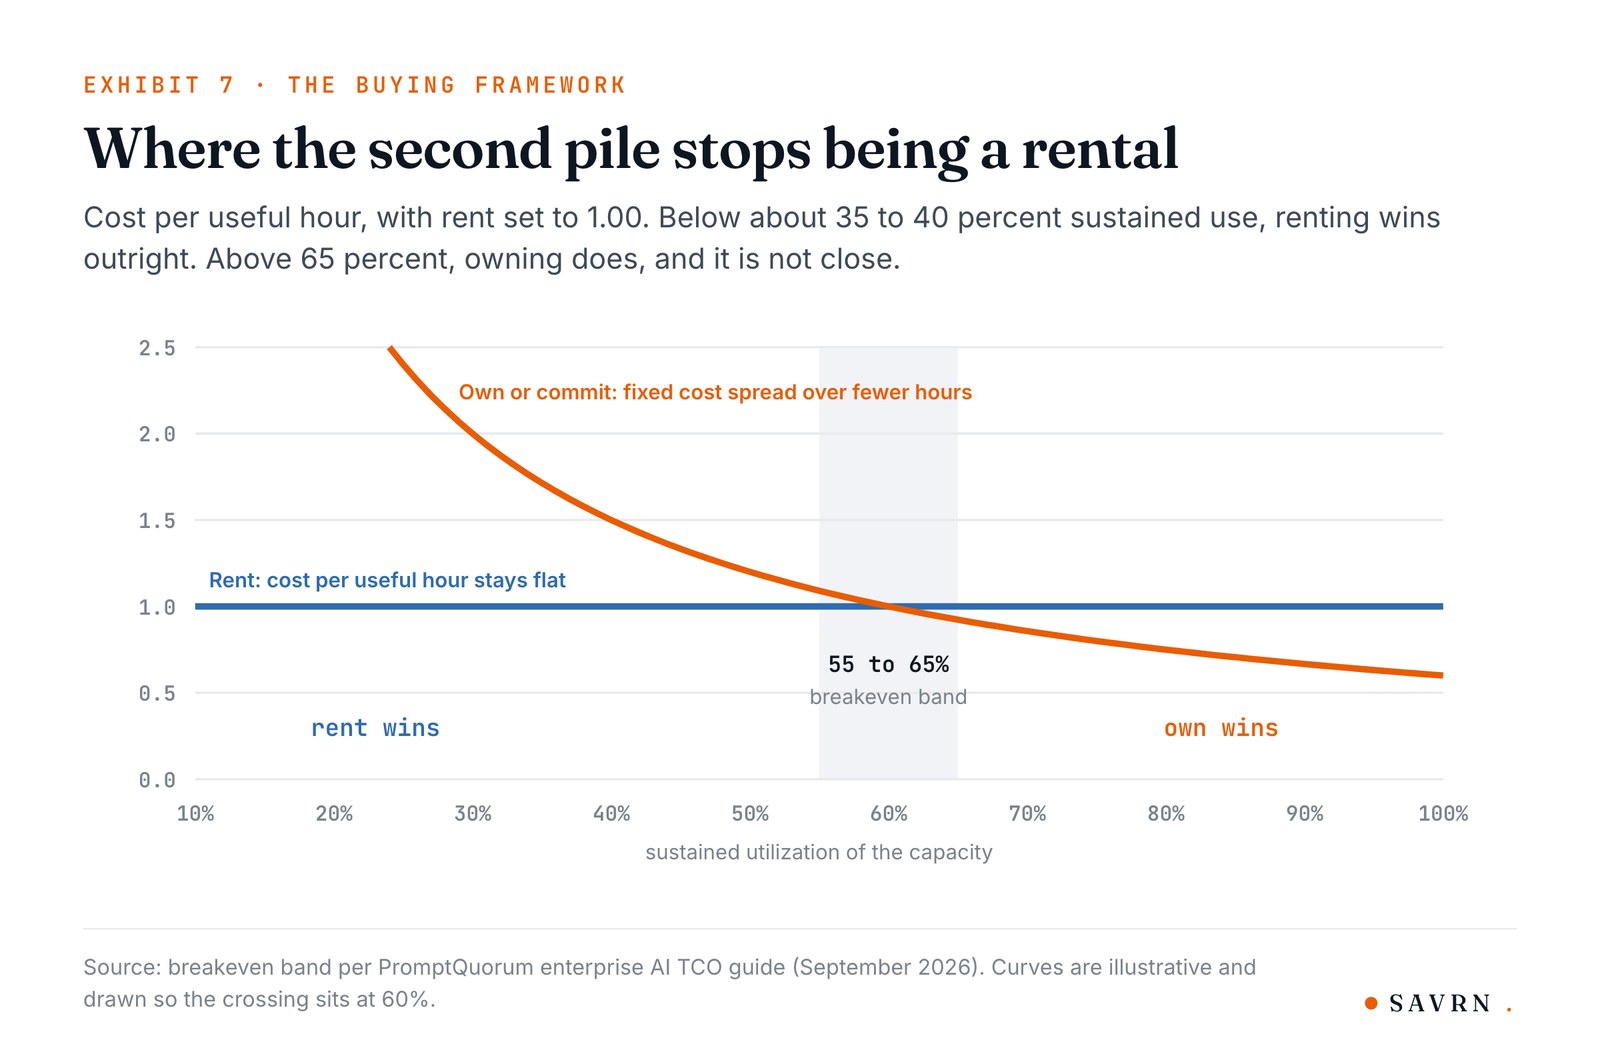
**Third, apply the breakeven.** Independent TCO work converges on one band: specifically, owning or committing to dedicated capacity beats renting at roughly 55 to 65 percent sustained utilization over a three-year horizon. Below about 35 percent, renting wins outright, while above 65 percent, owning wins and it is not close.[51] Buy the median, rent the spike, schedule the rest.

That is the whole framework on one screen.

<div class="btab"><p class="btab-cap"><b>Table 1</b> Sizing rule and contract form by workload class</p><div class="bcards one"><div class="bc"><div class="bc-head"><span class="bc-num">1</span><h4 class="bc-title">Baseline: steady daily load</h4></div><div class="bc-kv cols"><p class="kv"><span class="k">Sizing rule</span><span class="v">Size to the median and revisit annually.</span></p><p class="kv"><span class="k">Contract form</span><span class="v">Owned racks or a multi-year dedicated capacity envelope.</span></p></div></div><div class="bc"><div class="bc-head"><span class="bc-num">2</span><h4 class="bc-title">Burst: diurnal or seasonal peaks, 3x to 5x</h4></div><div class="bc-kv cols"><p class="kv"><span class="k">Sizing rule</span><span class="v">Pre-position before the peak and reserve nothing extra.</span></p><p class="kv"><span class="k">Contract form</span><span class="v">Pre-provisioned burst capacity or on-demand rental.</span></p></div></div><div class="bc"><div class="bc-head"><span class="bc-num">3</span><h4 class="bc-title">Deferrable: batch, evals, re-indexing</h4></div><div class="bc-kv cols"><p class="kv"><span class="k">Sizing rule</span><span class="v">Schedule into off-peak hours on purpose.</span></p><p class="kv"><span class="k">Contract form</span><span class="v">Batch API at about 50% of standard rates, or interruptible and spot capacity.</span></p></div></div></div></div>

The third card is the most underpriced insight in this post. OpenAI, Anthropic, and Google all sell batch inference at 50 percent of standard rates for 24-hour turnaround.[10] A provider does not print a standing 50 percent discount out of generosity, but rather as an admission of idle off-peak capacity they will pay you to absorb. Runway's overnight controller from Section 3 is the mirror image: the GPUs go to research jobs after dark, since the morning peak ends around 12:30 p.m. Eastern.[47] If your deferrable workloads run at 2 p.m. at full price, you are subsidizing someone else's discount. Buy the second pile on purpose.

### The contract: four terms, not a meter

For the baseline pile, contract form matters as much as price, because reserved GPU commitments bill whether you consume them or not, and reserved GPU contracts run 30 to 55 percent off on-demand for one-to-three-year terms.[51] AWS, for example, cut prices on its GPU instances in June 2025, up to 45 percent on P5 and 33 percent on P4, a reminder that a long commitment is a bet on where prices go.[93] The hedge is scope rather than term length.

We write capacity contracts as a workload-scoped envelope with four warranted terms: the model class the racks are licensed and sized to run, the numerical precision, the tokens per second per concurrent user, and the availability warranted.[94] Everything inside the envelope belongs to the buyer, and as a result the seller's incentive flips from rationing tokens to keeping racks busy. In our internal model, a canonical rack costs $3.66 million a year, which is $0.076 per million tokens at a 65 percent planning utilization. Idle capacity is our problem, not yours.[94] Whoever your provider is, get those four terms in writing, because a capacity contract without them is slideware with a signature line.

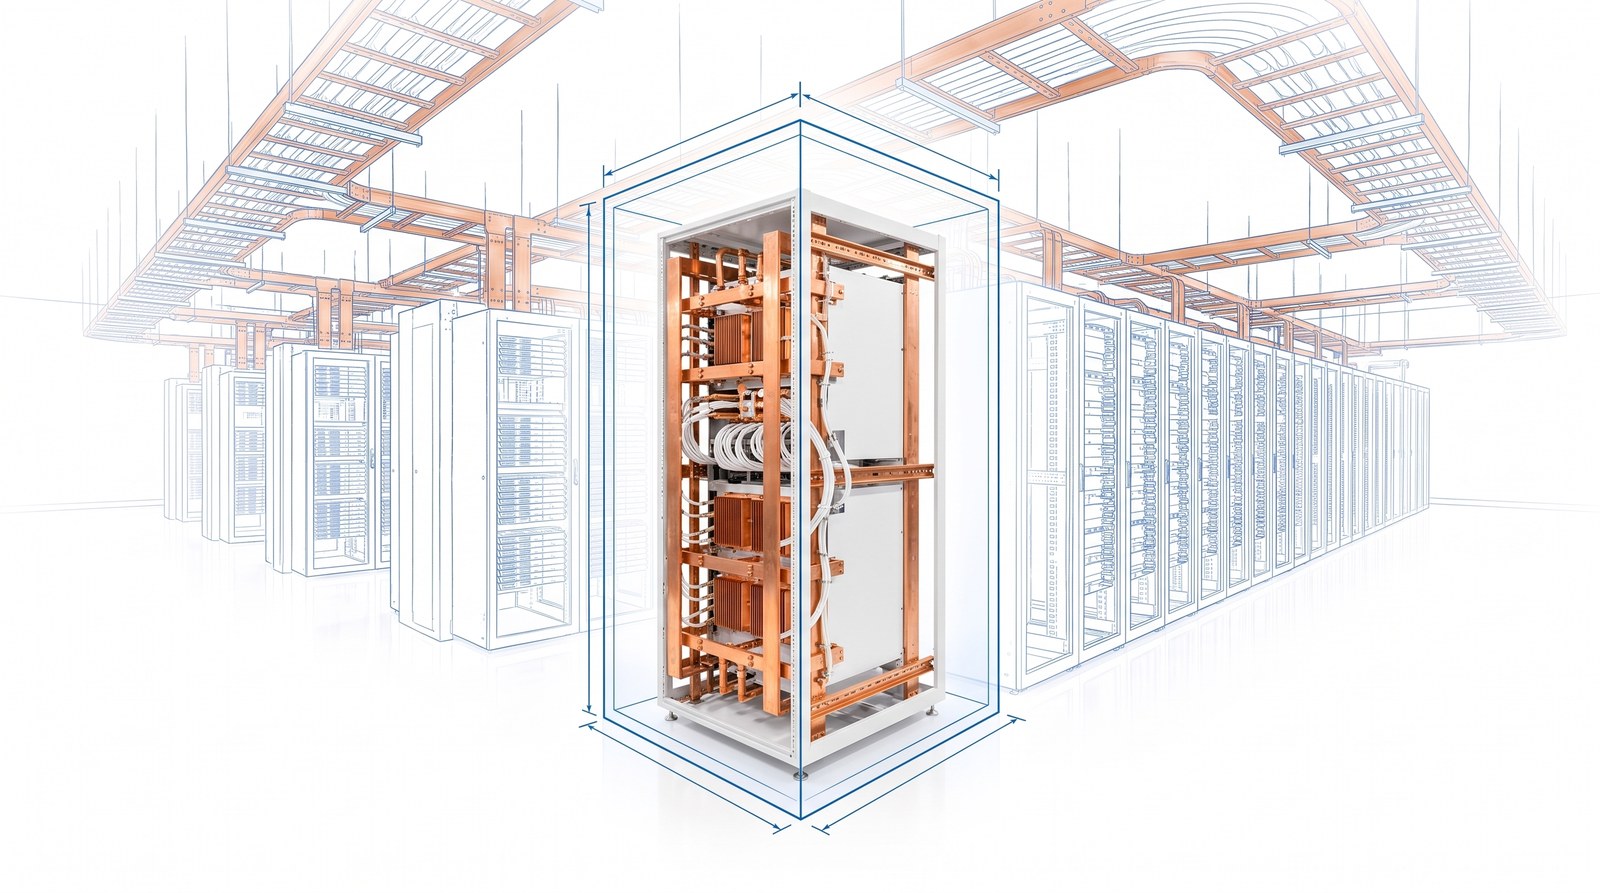
<figure class="bfig"><img src="/media/blog-ai-inference-capacity-art-envelope-20260919.jpg" alt="A single solid copper server rack inside a snug blueprint envelope, with a faded sprawling rack hall behind it." loading="lazy"><figcaption>A workload-scoped envelope: the model class, the precision, the tokens per second, and the availability.</figcaption></figure>

<figure class="bfig"><img src="/media/blog-ai-inference-capacity-ex7-breakeven-20260919.jpg" alt="Chart of cost per useful hour versus sustained utilization, with rent flat at 1.00 and ownership falling to cross it in a 55 to 65 percent breakeven band." loading="lazy"><figcaption>Exhibit 7. Where the second pile stops being a rental.</figcaption></figure>

The chart reduces the section to two lines and a crossing: ownership cost per useful hour falls with utilization because the capital is fixed, while the rental line does not care how busy you are. The crossing, in the 55 to 65 percent band, is where the second pile stops being a rental and becomes an asset. Everything left of the crossing is money you chose to overpay, whereas everything right of it that you still rent is margin you donated. In the shaded middle the raw dollars are close to a wash, and therefore contract quality decides: the four terms, the refresh option, the benchmark-linked throughput.

### The checklist for a capacity partner

Three gates. A provider who fails any one fails the evaluation.

**Gate one: latency and topology.** Where does the capacity sit relative to your users, and what is queue time at peak? Under-provisioned inference does not fail but queues, adding as much as two seconds or more at peak hours.[53] For voice and agent-facing workloads, abandonment spikes past 40 percent once response delay crosses one second.[54] Ask for the P99 at your peak hour, at their stated availability, in writing.

**Gate two: a timeline with power behind the date.** Six in ten enterprises wait more than four months from buying GPU capacity to a first production request, and only 6 percent get there in under two.[21] A delivery date without owned or secured power behind it is a hope rather than a plan. Ask who holds the interconnect, the generation, and the permits, and ask for the receipts.

**Gate three: data control.** Who owns the campus, the stack, and the data path? If your prompts and outputs traverse someone else's shared control plane, your governance is contractual where it should be physical. Single-tenant blocks, tenant-held keys, and an operator that runs every layer are the difference between auditing your infrastructure and trusting a SOC 2 PDF.

Finally, run the classification, do the arithmetic, write the four terms, and walk every candidate partner through the three gates, and Section 8 shows what it looks like when someone builds to this checklist.

## 8. How SAVRN Builds for This

Every constraint in this essay has a design response on our side of the ledger. That is not a coincidence, because we read the same queues, the same vacancy prints, and the same utilization telemetry you just did, and we built the company to answer them. Here is the mapping, taken one constraint at a time rather than all at once.

**Lead time.** Our supply-chain write-up benchmarks the industry standard for new capacity at 24 to 48 months,[95] whereas SAVRN's answer is the [Atom](https://savrn.com/solutions/ai-factory): 32 liquid-cooled racks, 8.8 MW of IT load under a 13.2 MW facility envelope, manufactured, shipped, crane-set, and commissioned as one unit, while running NVIDIA's latest GPUs at time of delivery.[96] One tenant per block. Because the Atom is factory-built rather than site-built, modular compute pods ship in 6 to 12 months.[95] Capacity stops being a construction project and instead becomes a repeatable unit you can order.

**The queue.** Because a 61-month median interconnection wait is not a schedule risk you plan around but a wall,[4] we generate behind the meter. The Electron family, Proton fuel cells plus Ion battery storage, powers each Atom on site, sized N+1 so one block can be serviced without touching output,[97] and since the power is made on site, there is no queue, no dependency on someone else's transmission study, and no waiting on a docket.

**Water and siting.** Inference wants to live near users, and metros are exactly where water permits kill projects, so the Atom's cooling is direct-to-chip liquid on a closed loop with no routine draw from community water,[96] which is what lets a factory site where latency demands it instead of where the watershed tolerates it.

**The community.** Because we build where people live, the host has to want us there, so every SAVRN campus ships with its own technical institute, ten departments and forty-three hands-on courses that train the people who run the factory.[98]

**Opacity.** Three units, no ticker, prices nobody can verify. In contrast, our facility operating layer tracks tokens per watt per dollar at the site level, and the [SAVRN Index](https://savrn.com/ai-index) publishes prices from 54 providers, each rechecked every three hours against the seller's own feed.[68] You should not have to take our word for what an H100 hour costs, so check it yourself instead.

**The second pile.** This is the new segment and the reason this essay exists: our model directory lists 2,965 open-weight models, each rendered as a spec card with license, parameter count, and context length,[91] because the spec card is becoming a procurement document. Pick the model and we scope dedicated capacity around it under a written envelope with four warranted terms, specifically the model class, the numerical precision, the tokens per second per concurrent user, and the availability.[94] The contract is a tolling agreement, a fixed capacity payment for a fixed term, with stepped pricing, refresh options into the next GPU generation, and throughput benchmarked against a stated harness instead of a marketing figure.[94] Everything inside the envelope belongs to you, and because our incentive after signature is to keep the racks busy, we do not sell the meter, a framing that comes from [The Unmetered Rack](https://savrn.com/blog/the-unmetered-rack).

### The personal part

I will say the personal part, because it drives the engineering. My grandparents had a rule for every job site and every dinner table: give more than you take. I have seen what a facility does to a town when it treats the town as a resource, and I have seen what happens when it treats the town as a partner. So we site where people live, we hire and train from the zip code first, and we measure a campus by what the region keeps after we leave. A campus that serves a region's tokens can reskill that region's workforce. That sentence is not marketing but a design constraint, and it is why the Institute sits inside the fence line instead of in a brochure.

### Where to start

First, find the models your teams already depend on among the 2,965 at [savrn.com/models](https://savrn.com/models). Then scope your second pile, specifically the bursts, the evals, the fine-tunes, and the agent workloads that do not belong on your baseline. Check our numbers against the market in the [SAVRN Index](https://savrn.com/ai-index), and finally, when you are ready to write an envelope around a workload, [contact us](https://savrn.com/contact). The conversation starts with four terms rather than a quote.

*Chad Everett Harris, Founder, SAVRN*

<details class="bsrc" markdown="1">
<summary>Sources</summary>

1. [CBRE, "North America Data Center Trends H2 2025," February 25, 2026.](https://www.cbre.com/insights/books/north-america-data-center-trends-h2-2025)
2. [SemiAnalysis, "The Great GPU Shortage: Rental Capacity and the H100 1 Year Rental Price Index," April 2, 2026.](https://newsletter.semianalysis.com/p/the-great-gpu-shortage-rental-capacity)
3. [Microsoft Investor Relations, FY26 Q4 earnings conference call, August 2026.](https://www.microsoft.com/en-us/investor/events/fy-2026/earnings-fy-2026-q4); [TechCrunch, "Microsoft expects some AI capacity constraints this quarter," April 30, 2025.](https://techcrunch.com/2025/04/30/microsoft-expects-some-ai-capacity-constraints-this-quarter/)
4. [Lawrence Berkeley National Laboratory, "Queued Up: 2026 Edition," June 2026.](https://emp.lbl.gov/sites/default/files/2026-06/Queued%20Up%202026%20Edition.pdf)
5. [Cast AI, "2026 State of Kubernetes Optimization Report," April 21, 2026.](https://cast.ai/press-release/2026-state-of-kubernetes-optimization-report/); [IT Brief, "Cast AI report finds 5% GPU use in Kubernetes clusters," April 22, 2026.](https://itbrief.co.uk/story/cast-ai-report-finds-5-gpu-use-in-kubernetes-clusters)
6. [acefleet.dev, "Utilization Headroom," synthesizing the Microsoft Philly trace and the Acme LLM trace, September 5, 2026.](https://acefleet.dev/blog/utilization-headroom); [Jeon et al., Philly trace paper, USENIX ATC 2019.](https://www.usenix.org/conference/atc19/presentation/jeon)
7. [Forbes reporting on Uber's Claude Code adoption, as compiled in bosio.digital, "AI Token Cost Guide," July 9, 2026.](https://bosio.digital/articles/ai-token-cost-guide)
8. [Flexera, "Flexera Finds Cloud Value is Rising While AI Waste Grows," 2026 State of the Cloud, March 18, 2026.](https://www.flexera.com/about-us/press-center/flexera-finds-cloud-value-is-rising-while-ai-waste-grows)
9. [AWS Machine Learning Blog, "Scaling Rufus with over 80,000 AWS Inferentia and AWS Trainium chips for Prime Day," October 10, 2024.](https://aws.amazon.com/blogs/machine-learning/scaling-rufus-the-amazon-generative-ai-powered-conversational-shopping-assistant-with-over-80000-aws-inferentia-and-aws-trainium-chips-for-prime-day/); [AWS Machine Learning Blog, "How Rufus doubled their inference speed and handled Prime Day traffic," May 28, 2025.](https://aws.amazon.com/blogs/machine-learning/how-rufus-doubled-their-inference-speed-and-handled-prime-day-traffic-with-aws-ai-chips-and-parallel-decoding/)
10. [OpenAI, Batch API guide.](https://developers.openai.com/api/docs/guides/batch); [Anthropic, Message Batches documentation.](https://platform.claude.com/docs/en/build-with-claude/batch-processing); [Google, Gemini API batch mode documentation.](https://ai.google.dev/gemini-api/docs/batch-api)
11. [Linkup, "The Real Cost of RAG," July 6, 2026.](https://www.linkup.so/blog/the-real-cost-of-rag)
12. [Tech Monitor, "Most AI training data could be synthetic by next year, says Gartner," August 2, 2023.](https://www.techmonitor.ai/ai-and-automation/ai-synthetic-data-edge-computing-gartner/)
13. [NVIDIA, Nemotron-CC-v2 dataset card, Hugging Face, August 18, 2025.](https://huggingface.co/datasets/nvidia/Nemotron-CC-v2)
14. [Salesforce, "AI and Agents Propel Record 2025 Holiday Shopping Season," January 8, 2026.](https://www.salesforce.com/news/stories/2025-holiday-shopping-data/)
15. [CapacityHive, "Outsourcing Tax Return Preparation," February 5, 2026.](https://capacityhive.com/outsourcing-tax-return-preparation/)
16. [Intuit, "How Intuit Transformed Tax Filing Experiences."](https://www.intuit.com/blog/innovative-thinking/tech-innovation/how-intuit-transformed-tax-filing-experiences/)
17. [EvalEval Coalition, "AI evals are becoming the new compute bottleneck," Hugging Face, April 29, 2026.](https://huggingface.co/blog/evaleval/eval-costs-bottleneck); [GetAIBook, "Evaluation Now Consumes 20% of AI Compute Budgets," April 29, 2026.](https://getaibook.com/news/evaluation-now-consumes-20-of-ai-compute-budgets/)
18. [cztech, "When Smaller Wins: Why Fine-Tuned Models Beat the Frontier" (Checkr case), May 6, 2026.](https://cztech.substack.com/p/when-smaller-wins-why-fine-tuned)
19. [Predibase, "LoRA Land: 25 Fine-Tuned Mistral-7b LLMs that Rival or Outperform GPT-4," The Sequence, February 23, 2024.](https://thesequence.substack.com/p/guest-post-lora-land-25-fine-tuned)
20. [Signal65, "The Economics of Agentic AI," May 1, 2026.](https://signal65.com/wp-content/uploads/2026/05/Signal65-Insights_The-Economics-of-Agentic-AI.pdf)
21. [CoreWeave, "From Experimentation to Production: Why Inference Is the Defining Layer of AI," June 22, 2026.](https://www.coreweave.com/blog/from-experimentation-to-production-why-inference-is-the-defining-layer-of-ai)
22. [Bai et al., "How Do AI Agents Spend Your Money? Analyzing and Predicting Token Consumption in Agentic Coding Tasks," arXiv:2604.22750, April 24, 2026.](https://arxiv.org/abs/2604.22750)
23. [OpenAI, "The state of enterprise AI: 2025 Report," December 2025.](https://cdn.openai.com/pdf/7ef17d82-96bf-4dd1-9df2-228f7f377a29/the-state-of-enterprise-ai_2025-report.pdf)
24. [Gartner, "Gartner Forecasts Worldwide AI Spending to Grow 49.5% in 2026," press release, September 16, 2026.](https://www.gartner.com/en/newsroom/press-releases/2026-09-16-gartner-forecasts-worldwide-ai-spending-to-grow-49-point-5-percent-in-2026); [TechEdgeAI, "Gartner Forecasts $2.7 Trillion in AI Spending in 2026."](https://techedgeai.com/gartner-forecasts-worldwide-ai-spending-to-grow-49-5-in-2026/)
25. [McKinsey & Company, "The cost of compute: A $7 trillion race to scale data centers," April 28, 2025.](https://www.mckinsey.com/industries/technology-media-and-telecommunications/our-insights/the-cost-of-compute-a-7-trillion-dollar-race-to-scale-data-centers)
26. [IDC Worldwide Quarterly AI Infrastructure Tracker, "AI Infrastructure Spending Reached a Record $86B in Q3 2025," February 5, 2026.](https://www.pressreleasepoint.com/ai-infrastructure-spending-reached-record-86b-q3-2025-according-idc)
27. [Menlo Ventures, "2025: The State of Generative AI in the Enterprise," December 9, 2025.](https://menlovc.com/perspective/2025-the-state-of-generative-ai-in-the-enterprise/)
28. [Deloitte, "TMT Predictions 2026: Why AI's next phase will likely demand more computational power, not less," November 18, 2025.](https://www.deloitte.com/us/en/insights/industry/technology/technology-media-and-telecom-predictions/2026/compute-power-ai.html)
29. [McKinsey & Company, "The future of AI workloads," February 24, 2026.](https://www.mckinsey.com/featured-insights/charts/the-future-of-ai-workloads)
30. [Kumar and Manning, "Trends in Frontier AI Model Count: A Forecast to 2028," arXiv:2504.16138, April 2025.](https://arxiv.org/html/2504.16138v1)
31. [Precedence Research, "AI Inference-as-a-Service Market," September 9, 2026.](https://www.precedenceresearch.com/ai-inference-as-a-service-market)
32. [Fortune Business Insights, "AI Inference Market."](https://www.fortunebusinessinsights.com/ai-inference-market-113705)
33. [Polaris Market Research, "AI Inference Market."](https://www.polarismarketresearch.com/industry-analysis/ai-inference-market)
34. [Research and Markets, "AI Inference Market Outlook."](https://www.researchandmarkets.com/reports/6183534/ai-inference-market-outlook-market-share)
35. [Stanford HAI, "The 2025 AI Index Report," April 2025.](https://hai.stanford.edu/ai-index/2025-ai-index-report)
36. [Gundlach et al., "The Price of Progress: Algorithmic Efficiency and the Falling Cost of AI Inference," NeurIPS 2025 workshop, arXiv:2511.23455, November 2025.](https://arxiv.org/html/2511.23455v1)
37. [Epoch AI, "LLM inference prices have fallen rapidly but unequally across tasks," March 12, 2025.](https://epoch.ai/data-insights/llm-inference-price-trends)
38. [Kokin, llm-price-trends, an open reproduction of Epoch's method (GitHub).](https://github.com/MichaelKokin/llm-price-trends)
39. [NVIDIA, "New SemiAnalysis InferenceX Data Shows NVIDIA Blackwell Ultra Delivers up to 50x Better Performance and 35x Lower Costs for Agentic AI," February 16, 2026.](https://blogs.nvidia.com/blog/data-blackwell-ultra-performance-lower-cost-agentic-ai/); [SemiAnalysis, InferenceX, DeepSeek-R1 GB200 vs GB300.](https://inferencex.semianalysis.com/compare/deepseek-r1-gb200-vs-gb300)
40. [StorageReview, "NVIDIA Sets MLPerf Inference v6.0 Records with Blackwell Ultra Platform," April 1, 2026.](https://www.storagereview.com/news/nvidia-sets-mlperf-inference-v6-0-records-with-blackwell-ultra-platform)
41. [Andreessen Horowitz, "Welcome to LLMflation: LLM inference cost is going down fast," November 12, 2024.](https://a16z.com/llmflation-llm-inference-cost/)
42. [Aperta Res, "AI and the Jevons Paradox in 2026," August 1, 2026.](https://apertares.com/article/ai-jevons-paradox-2026)
43. [Center Consulting, "Jevons Paradox for Compute," January 27, 2025.](https://www.centerconsulting.com/ai-library/concepts/jevons-paradox-for-compute)
44. [Ed Zitron, "OpenAI's inference spend, per leaked Microsoft documents," Where's Your Ed At, November 12, 2025.](https://www.wheresyoured.at/oai_docs/)
45. ["LithOS: An Operating System for Efficient Machine Learning on GPUs," Carnegie Mellon University and Meta, arXiv:2504.15465, April 2025.](https://arxiv.org/html/2504.15465v1)
46. [GMI Cloud, "Burst Capacity for AI Inference: How to Handle Traffic Spikes Without Over-Provisioning," July 2026.](https://www.gmicloud.ai/en/blog/burst-capacity-for-ai-inference-how-to-handle-traffic-spikes-without-over-provisioning)
47. [Runway, "Borrowing the Night: Reclaiming Idle Inference GPUs for Research," July 2, 2026.](https://runway.com/news/engineering/borrowing-the-night-reclaiming-idle-inference-gpus-for-research)
48. [GMI Cloud, "Cloud GPU Pricing Models Explained: On-Demand vs Reserved vs Serverless," July 7, 2026.](https://www.gmicloud.ai/en/blog/cloud-gpu-pricing-models-explained)
49. [Lyceum Technology, "Reserved vs On-Demand GPU Strategy 2026: The Engineer's Guide," May 16, 2026.](https://lyceum.technology/magazine/reserved-vs-on-demand-gpu-strategy-2026/)
50. [GridStackHub, "GPU Reserved Instance Pricing Guide 2026," May 4, 2026.](https://www.gridstackhub.ai/gpu-reserved-pricing-guide-2026)
51. [PromptQuorum, "Renting GPU Cloud vs Buying On-Prem Hardware for Enterprise AI," September 3, 2026.](https://www.promptquorum.com/local-llms/renting-gpu-cloud-vs-buying-on-prem-enterprise-ai)
52. [TimInsight, "System Performance Fundamentals: Average TPS vs Peak TPS," May 18, 2026.](https://timinsight.com/system-performance-average-vs-peak-tps-en/)
53. [CrazyRouter, "AI API Latency Optimization: 10 Proven Strategies," March 4, 2026.](https://crazyrouter.com/blog/ai-api-latency-optimization-guide-2026)
54. [BitBytes, "Voice AI Latency in 2026: The 300ms Rule," May 25, 2026.](https://www.bitbytes.io/blog/ai-voice-speech-tools/voice-ai-latency-response-time)
55. [Grid Strategies, "Power Demand Forecasts Revised Up for Third Year Running, Led by Data Centers," November 2025.](https://gridstrategiesllc.com/wp-content/uploads/Grid-Strategies-National-Load-Growth-Report-2025.pdf)
56. [International Energy Agency, "Energy and AI: Energy demand from AI," April 2025.](https://www.iea.org/reports/energy-and-ai/energy-demand-from-ai)
57. [EPRI, "Data Centers Could Consume Up to 17% of U.S. Electricity by 2030," February 26, 2026.](https://www.globenewswire.com/news-release/2026/2/26/3245491/0/en/epri-data-centers-could-consume-up-to-17-of-u-s-electricity-by-2030.html)
58. [Yahoo Finance, "Jensen Huang Just Said a 1-Gigawatt Facility Is Worth $50 Billion to $60 Billion," September 7, 2026.](https://finance.yahoo.com/technology/ai/articles/jensen-huang-just-said-1-110300322.html)
59. [Epoch AI, "Servers account for 60% of the total cost of ownership of a one-gigawatt AI data center," May 14, 2026.](https://epoch.ai/data-insights/ai-datacenter-cost-breakdown)
60. [PowerLink, sources and appendix citing the Wood Mackenzie Q2 2025 transformer survey, June 2026.](https://powerlinkdp.com/sources)
61. [Relutech, "How Enterprises Can Buy NVIDIA H100 and H200 GPUs When OEM Allocations Are Unavailable," June 18, 2026.](https://relutech.com/blogs/hardware/buy-nvidia-h100-h200-gpus-secondary-market)
62. [AL Capital Advisory, "AI Capex Cycle 2026: $775-800B Hyperscaler Buildout," August 7, 2026.](https://alcapitaladvisory.com/research/intelligence/ai-infrastructure.html)
63. [Tech-Insider, "2026 Memory Chip Shortage: SK Hynix Warns It May Last Past 2030," March 19, 2026.](https://tech-insider.org/memory-chip-shortage-2026-ai-consumer-electronics/)
64. [JLL, "Data center availability crisis deepens as vacancy hits historic low," August 18, 2025.](https://www.jll.com/en-us/newsroom/data-center-availability-crisis-deepens-as-vacancy-hits-historic-low)
65. [Brightlio, "Data Center Market Trends," citing Cushman & Wakefield H2 2025.](https://brightlio.com/data-center-market-trends/)
66. [Data Center Watch, Q1 2026 report, via Cliff Center, July 7, 2026.](https://www.cliffcenter.com/dockets/i/2026-07-07-data-center-watch-q1-2026-report-130b-in)
67. [Sussman, "A Call for a National Data Center Moratorium and Policy Framework," Environmental Law Reporter, Environmental Law Institute, 2026.](https://www.eli.org/sites/default/files/files-pdf/56.Data_Center_Moratorium.pdf)
68. [SAVRN, "The SAVRN Index," September 13, 2026.](https://savrn.com/blog/savrn-index)
69. [SAVRN, "Twenty Cents to Twenty-Five Dollars," August 28, 2026.](https://savrn.com/blog/twenty-cents-to-twenty-five-dollars); [SAVRN Index pricing overview.](https://savrn.com/ai-index/pricing)
70. [Runpod, "Top 8 Together AI Alternatives for 2026," September 13, 2026, reporting Fireworks AI price changes effective September 1, 2026.](https://www.runpod.io/articles/alternatives/togetherai)
71. [Coloprice, "GPU Futures Arrive: CME and ICE Make Compute a Tradable Commodity," August 2, 2026.](https://coloprice.com/guides/gpu-futures-cme-ice/)
72. [Silicon Data, "The Practitioner's Guide to the Compute Future: How to Hedge, Step by Step," September 2026.](https://www.silicondata.com/blog/practitioners-guide-compute-future-hedge-step-by-step)
73. [Introl, "GPU Cloud Price Collapse: H100 Market," January 12, 2026.](https://introl.com/blog/gpu-cloud-price-collapse-h100-market-december-2025)
74. [Bloomberg Law, "Anthropic to Pay Nscale $45 Billion for AI Computing Power," August 26, 2026.](https://news.bloomberglaw.com/artificial-intelligence/anthropic-to-pay-nscale-45-billion-for-ai-computing-power)
75. [SiliconANGLE, "Data center builder Nscale files for IPO after multibillion-dollar Anthropic deal," September 18, 2026.](https://siliconangle.com/2026/09/18/data-center-builder-nscale-files-for-ipo-after-multibillion-dollar-anthropic-deal/)
76. [Nebius Group N.V., Form 6-K on the Microsoft agreement, U.S. Securities and Exchange Commission, September 8, 2025.](https://www.sec.gov/Archives/edgar/data/1513845/000110465925088312/tm2525580d1_6k.htm)
77. [TechCrunch, "Crusoe reportedly raises $3B at a $30B valuation," September 3, 2026.](https://techcrunch.com/2026/09/03/crusoe-reportedly-raises-3b-at-a-30b-valuation/)
78. [Investing.com, "Earnings call transcript: Nebius beats Q2 2026 forecasts, shares jump 16.5%."](https://www.investing.com/news/transcripts/earnings-call-transcript-nebius-beats-q2-2026-forecasts-shares-jump-165-93CH-4855076)
79. [Synergy Research Group, "Neoclouds Currently Growing by Over 200% per Year; Will Reach $180 Billion in Revenues by 2030," October 13, 2025.](https://www.srgresearch.com/articles/neoclouds-currently-growing-by-over-200-per-year-will-reach-180-billion-in-revenues-by-2030)
80. [Amazon Web Services, Amazon Bedrock pricing, Provisioned Throughput.](https://aws.amazon.com/bedrock/pricing/)
81. [FinOpsLLM, "Azure OpenAI vs Direct Cost," July 12, 2026.](https://finopsllm.com/research/azure-openai-vs-direct-cost); [Microsoft Learn, Provisioned throughput for Azure OpenAI.](https://learn.microsoft.com/en-us/azure/foundry/openai/concepts/provisioned-throughput)
82. [Pranay Jha, "Vertex AI Pricing: Provisioned Throughput," July 11, 2026.](https://drpranayjha.com/vertex-ai-pricing-provisioned-throughput-caching/)
83. [Epoch AI, "Open models lag state-of-the-art closed models by 4 months," May 29, 2026.](https://epoch.ai/data-insights/open-closed-eci-gap)
84. [Stanford HAI, "Technical Performance," The 2025 AI Index Report, April 2025.](https://hai.stanford.edu/ai-index/2025-ai-index-report/technical-performance)
85. [OpenAI, gpt-oss-120b and gpt-oss-20b (GitHub).](https://github.com/openai/gpt-oss)
86. [Crypto Briefing, "The gap between frontier and open-weight AI models has widened to 29 Elo points," citing the Arena leaderboard.](https://cryptobriefing.com/arena-ai-frontier-open-weight-model-gap-widens/)
87. [Hugging Face, "State of Open Source on Hugging Face: Spring 2026," March 17, 2026.](https://huggingface.co/blog/huggingface/state-of-os-hf-spring-2026); [Hugging Face, "State of Open Models: Summer 2026," August 14, 2026.](https://huggingface.co/blog/state-of-open-models-summer-2026)
88. [Zhao et al., "LoRA Land: 310 Fine-tuned LLMs that Rival GPT-4, A Technical Report," arXiv:2405.00732, April 29, 2024.](https://arxiv.org/abs/2405.00732)
89. [OpenRouter and a16z, "State of AI 2025: An Empirical 100 Trillion Token Study," December 2025.](https://openrouter.ai/state-of-ai)
90. [PromptQuorum, "Local LLM commercial license guide for business," September 3, 2026.](https://www.promptquorum.com/local-llms/local-llm-commercial-license-guide-business); [The Decoder, "Meta releases first multimodal Llama 4 models, leaves the EU out in the cold."](https://the-decoder.com/meta-releases-first-multimodal-llama-4-models-leaves-eu-out-in-the-cold/)
91. [SAVRN Model Hub, "Open-Weight AI Models: Compare Cards, Specs and Licenses," September 19, 2026.](https://savrn.com/models)
92. [Lambert and Brand, "The ATOM Report: Measuring the Open Language Model Ecosystem," arXiv:2604.07190, April 8, 2026.](https://arxiv.org/html/2604.07190v1)
93. [AWS, "Announcing up to 45% price reduction for Amazon EC2 NVIDIA GPU-accelerated instances," June 5, 2025.](https://aws.amazon.com/blogs/aws/announcing-up-to-45-price-reduction-for-amazon-ec2-nvidia-gpu-accelerated-instances/)
94. [SAVRN, "The Unmetered Rack," September 2, 2026 (four-term envelope; rack economics from SAVRN's internal model).](https://savrn.com/blog/the-unmetered-rack)
95. [SAVRN, "The AI Data Center Supply Chain," May 14, 2026.](https://savrn.com/blog/ai-data-center-supply-chain)
96. [SAVRN, "The Atom, AI Factory."](https://savrn.com/solutions/ai-factory)
97. [SAVRN, "Proton Fuel-Cell Power."](https://savrn.com/solutions/fuel-cell-power)
98. [SAVRN, "The SAVRN Institute."](https://savrn.com/institute)

</details>

## Frequently asked questions

### What counts as an "outside the baseline" AI workload?

Any inference demand your steady-state capacity was not sized for, in particular batch and deferrable jobs like nightly document pipelines and embedding rebuilds, which OpenAI, Anthropic, and Google all price at 50 percent of standard rates for 24-hour turnaround.[10] Episodic spikes count too, for example Amazon's Rufus, which ran on more than 80,000 chips at about 3 million tokens a minute during Prime Day.[9] Evaluation runs qualify since one Holistic Agent Leaderboard run costs about $40,000, and so do fine-tuning bursts.[17] Agent swarms belong on the list as well, because they burn 4 to 15 times the tokens of a chat session.[20]

### How much AI inference capacity sits idle?

It depends on what you count, since Cast AI measured 5 percent average GPU utilization across production Kubernetes clusters from January 2025 to April 2026,[5] while Microsoft's Philly cluster trace found about 52 percent at the job level.[6] A Meta ads inference service running on H100s averaged 27 percent device utilization over a week.[45] In fact, all three point the same way: capacity is bought for a peak and billed all day.

### When does dedicated capacity beat on-demand pricing?

The crossover is sustained utilization rather than volume. Three-year TCO models put the own-versus-rent breakeven near 55 to 65 percent sustained utilization, while below about 35 percent renting wins outright.[51] The trap sits in the middle, because reserved hours bill whether you use them or not, and Flexera's 2026 report found wasted cloud spend rising to 29 percent, the first increase in five years, as AI workloads surged.[8] If your workload runs hot for two weeks a quarter, you want capacity that exists when you need it rather than a reservation you feed all year.

### How big is the AI inference market?

It depends on the scope, since Precedence Research sizes inference-as-a-service at $18.6 billion in 2025, growing to $197.5 billion by 2035,[31] whereas broader estimates that include hardware and edge devices run $103.7 billion to $125.8 billion for the same year.[32, 34] Meanwhile, Deloitte puts inference at roughly two-thirds of all AI compute in 2026.[28] Name the scope first, before you quote a number.

### Why do token prices fall while enterprise AI bills rise?

Because volume outruns efficiency. Stanford's AI Index recorded a 280-fold drop in the price of GPT-3.5-class tokens between November 2022 and October 2024,[35] while over the same window Menlo Ventures counts enterprise generative AI spend rising from $1.7 billion to $37 billion.[27] Google's monthly token processing grew about 330 times in two years while energy per median prompt fell 33 times.[42] Cheaper units, far more of them.

### Why do burst workloads favor open-weight models?

Spend and volume have diverged, since frontier APIs hold the dollars while open-weight models carried roughly a third of the tokens tracked by OpenRouter and a16z by late 2025.[89] They trail the closed frontier by only about four months.[83] Because open weights travel with your capacity, there is no renegotiating a license when you move a workload, and small fine-tuned models have matched GPT-4 on specific tasks for under $8 of training each, on average.[19] For example, SAVRN's [model directory](https://savrn.com/models) lists 2,965 of them with license and spec cards.[91]

### How long does it take to get new AI data center capacity?

Longer than most plans assume, because the median power project that reached commercial operation in 2025 waited 61 months for its grid connection.[4] Large power transformers average about 128 weeks of lead time, while CoWoS packaging is fully allocated through at least mid-2027,[60, 61] and CBRE measured vacancy at 1.4 percent at the end of 2025.[1] By contrast, factory-built, on-site-powered blocks like the SAVRN Atom ship in 6 to 12 months against a 24-to-48-month industry benchmark.[95]

### What is a workload-scoped capacity envelope?

Four warranted terms, written down: first the model class the machine is licensed and sized to run, second the numerical precision it runs at, third the tokens per second per concurrent user it will sustain, and finally the availability it is warranted to hold. Everything inside those terms belongs to the buyer,[94] which makes it the Unmetered Rack idea applied to one workload: a fixed capacity payment for dispatch rights over a defined machine, instead of a blank meter.

### How is this different from a hyperscaler reserved instance?

Hyperscaler units strand spend in three ways. The first is Bedrock Model Units, which bill hourly whether used or not, and AWS's own example for Cohere Command runs $49.50 per unit-hour with no commitment and $23.77 on a six-month term.[80] The second is Azure PTU reservations, which cut rates up to 82 percent but still bill idle and do not guarantee capacity, although they are at least model-independent, so a model swap does not strand them.[81] The third is Vertex GSUs, which carry terms from one week to one year, while throughput varies by model.[82] Miss your traffic forecast and any of the three keeps billing. A workload-scoped envelope is defined against the workload itself rather than an abstract throughput unit.

### What is the SAVRN Index, and how does it price GPU hours?

The [SAVRN Index](https://savrn.com/ai-index) tracks GPU hours, wholesale contracts and landlord rents, frontier model tokens, and open-model prices, and as of September 13, 2026, it held 732 prices from 54 providers, each checked every three hours against the seller's own feed or page.[68] For example, on that date the typical H100 price was $3.99 per GPU-hour across 61 prices, from $1.63 on spot at Verda to $12.29 on demand at Azure.[68]