# How AI Weather Forecasting Helps People Prepare

> AI made weather forecasts faster and cheaper to run. Here is where that helps people prepare, from hurricanes to fungicide sprays, and where it still falls short.

Source: https://savrn.com/blog/ai-weather-forecasting-how-people-prepare
Author: Chad Everett Harris
Published: 2026-10-25

---

AI weather forecasting moved into the hurricane forecast office in 2025, and Hurricane Melissa showed what that means. On October 25, 2025, Melissa was strengthening fast in the Caribbean. That afternoon, National Hurricane Center forecasters wrote that two sets of guidance agreed. Their regional hurricane models and the Google DeepMind ensembles both suggested rapid strengthening could last 36 to 48 more hours.<sup class="cite"><a href="https://www.nhc.noaa.gov/archive/2025/al13/al132025.discus.018.shtml" rel="noopener" title="National Hurricane Center: Hurricane Melissa Discussion Number 18, October 25, 2025">1</a></sup> In fact, that one line is a small piece of history, because it shows AI guidance sitting next to traditional models during a real storm while people still had time to act.

The center gave almost three days of notice that Melissa would reach Jamaica as a Category 5 hurricane. It was the first time the center had forecast a hurricane to reach Category 5 from such a low starting intensity.<sup class="cite"><a href="https://www.nhc.noaa.gov/pdf/NHC_Verification_Report_2025_Preview.pdf" rel="noopener" title="National Hurricane Center: 2025 Verification Report Preview">2</a></sup> In addition, four days before landfall the forecast track was off by only about 13 miles.<sup class="cite"><a href="https://www.nhc.noaa.gov/pdf/NHC_Verification_Report_2025_Preview.pdf" rel="noopener" title="National Hurricane Center: 2025 Verification Report Preview">2</a></sup>

I build AI factories for a living, so I watch where AI produces something useful in the physical world. Weather is one of the clearest cases I know. The models are fast, and the results get graded every day. Above all, the payoff shows up in decisions people make with their own hands: when to board up, when to stage a crew, when to spray a field, when to plant.

This article explains what changed, where the new forecasts help, and where they still fall short. It also covers what anyone who depends on the weather can do with them. That includes us, since we run power and cooling equipment that cares a great deal about tomorrow's temperature.

<div class="btab"><div class="btab-cap"><b>Key figures</b> The numbers behind this article, with sources</div><div class="brows"><div class="br"><span class="br-k">GraphCast 10-day global forecast</span><span class="br-v">&lt;1 min</span><span class="br-b">Google DeepMind, 2023 <sup class="cite"><a href="https://arxiv.org/pdf/2212.12794" rel="noopener" title="Lam et al.: GraphCast, learning skillful medium-range global weather forecasting (Science 2023, arXiv preprint)">3</a></sup></span></div><div class="br"><span class="br-k">GenCast targets better than Europe's ensemble</span><span class="br-v">97.2%</span><span class="br-b">of 1,320 targets <sup class="cite"><a href="https://deepmind.google/discover/blog/gencast-predicts-weather-and-the-risks-of-extreme-conditions-with-sota-accuracy/" rel="noopener" title="Google DeepMind: GenCast predicts weather and the risks of extreme conditions, December 4, 2024">4</a></sup></span></div><div class="br"><span class="br-k">NOAA AI forecast computing vs. standard model</span><span class="br-v">0.3%</span><span class="br-b">AIGFS, Dec 2025 <sup class="cite"><a href="https://www.noaa.gov/news-release/noaa-deploys-new-generation-of-ai-driven-global-weather-models" rel="noopener" title="NOAA: NOAA deploys new generation of AI-driven global weather models, December 17, 2025">5</a></sup></span></div><div class="br"><span class="br-k">ECMWF AI forecast energy use</span><span class="br-v">~1,000x less</span><span class="br-b">ECMWF, Feb 2025 <sup class="cite"><a href="https://www.ecmwf.int/en/about/media-centre/news/2025/ecmwfs-ai-forecasts-become-operational" rel="noopener" title="ECMWF: ECMWF&#x27;s AI forecasts become operational, February 25, 2025">6</a></sup></span></div><div class="br"><span class="br-k">Cut in hurricane track error, 24–72 h</span><span class="br-v">~75%</span><span class="br-b">past two decades, NHC <sup class="cite"><a href="https://www.nhc.noaa.gov/verification/pdfs/Verification_2025.pdf" rel="noopener" title="National Hurricane Center: Forecast Verification Report, 2025 Hurricane Season, March 30, 2026">7</a></sup></span></div><div class="br"><span class="br-k">Notice of Melissa's Category 5 landfall</span><span class="br-v">~3 days</span><span class="br-b">NHC, Oct 2025 <sup class="cite"><a href="https://www.nhc.noaa.gov/pdf/NHC_Verification_Report_2025_Preview.pdf" rel="noopener" title="National Hurricane Center: 2025 Verification Report Preview">2</a></sup></span></div><div class="br"><span class="br-k">Damage avoided with 24 hours' notice</span><span class="br-v">30%</span><span class="br-b">United Nations <sup class="cite"><a href="https://www.un.org/sites/un2.un.org/files/2025-12-02-fast-facts/EarlyWarnings_FastFacts.pdf" rel="noopener" title="United Nations: Fast Facts, Early Warnings for All, December 2025">8</a></sup></span></div><div class="br"><span class="br-k">U.S. billion-dollar disasters, 2025</span><span class="br-v">23</span><span class="br-b">about $115.0 billion <sup class="cite"><a href="https://www.climatecentral.org/report/us-billion-dollar-weather-and-climate-disasters-2025" rel="noopener" title="Climate Central: U.S. Billion-Dollar Weather and Climate Disasters, 2025, March 9, 2026">9</a></sup></span></div><div class="br"><span class="br-k">Wheat scab control from a well-timed spray</span><span class="br-v">40–60%</span><span class="br-b">vs. no spray <sup class="cite"><a href="https://news.utcrops.com/?p=17859" rel="noopener" title="UT Crops News: Wheat in bloom, check your scab risk, May 1, 2019">10</a></sup></span></div><div class="br"><span class="br-k">Farmers given AI monsoon forecasts, India 2025</span><span class="br-v">38 million</span><span class="br-b">Google <sup class="cite"><a href="https://blog.google/technology/research/indian-farmers-monsoon-prediction/" rel="noopener" title="Google: AI monsoon forecasts for Indian farmers, September 15, 2025">11</a></sup></span></div></div></div>

## The forecast you get has changed

For decades, weather forecasting ran on one method. Supercomputers solve the equations of the atmosphere step by step, starting from millions of observations. That method still works, and it still matters. However, since 2023 a second method has moved from research papers into daily operations.

First, Google DeepMind published GraphCast. It produced a 10-day global forecast in under one minute and beat the leading traditional forecast on 90% of 1,380 test measures.<sup class="cite"><a href="https://arxiv.org/pdf/2212.12794" rel="noopener" title="Lam et al.: GraphCast, learning skillful medium-range global weather forecasting (Science 2023, arXiv preprint)">3</a></sup> Second, GenCast added probabilities. It was more accurate than Europe's leading ensemble forecast on 97.2% of 1,320 targets.<sup class="cite"><a href="https://deepmind.google/discover/blog/gencast-predicts-weather-and-the-risks-of-extreme-conditions-with-sota-accuracy/" rel="noopener" title="Google DeepMind: GenCast predicts weather and the risks of extreme conditions, December 4, 2024">4</a></sup> In addition, one 15-day GenCast forecast took 8 minutes on a single chip.<sup class="cite"><a href="https://deepmind.google/discover/blog/gencast-predicts-weather-and-the-risks-of-extreme-conditions-with-sota-accuracy/" rel="noopener" title="Google DeepMind: GenCast predicts weather and the risks of extreme conditions, December 4, 2024">4</a></sup>

After that, the big public weather centers moved. Specifically, the European Centre for Medium-Range Weather Forecasts (ECMWF) put its AI model into operations on February 25, 2025.<sup class="cite"><a href="https://www.ecmwf.int/en/about/media-centre/news/2025/ecmwfs-ai-forecasts-become-operational" rel="noopener" title="ECMWF: ECMWF&#x27;s AI forecasts become operational, February 25, 2025">6</a></sup> Its AI ensemble of 51 forecasts followed on July 1, 2025.<sup class="cite"><a href="https://www.ecmwf.int/en/about/media-centre/news/2025/ecmwfs-ensemble-ai-forecasts-become-operational" rel="noopener" title="ECMWF: ECMWF&#x27;s ensemble AI forecasts become operational, July 1, 2025">12</a></sup> Meanwhile, NOAA deployed three AI-driven global models in the United States in December 2025.<sup class="cite"><a href="https://www.noaa.gov/news-release/noaa-deploys-new-generation-of-ai-driven-global-weather-models" rel="noopener" title="NOAA: NOAA deploys new generation of AI-driven global weather models, December 17, 2025">5</a></sup>

As a result, the forecast behind your phone's weather app may already include AI guidance. Even so, nobody threw out the old method. Instead, both run side by side, and forecasters compare them.

## How an AI weather model works, in plain terms

An AI weather model learns from the past. Specifically, it studies decades of "reanalysis" data. A reanalysis combines past observations with a physics model to build a complete, consistent picture of the atmosphere for every hour.<sup class="cite"><a href="https://cds.climate.copernicus.eu/datasets/reanalysis-era5-single-levels" rel="noopener" title="Copernicus Climate Data Store: ERA5 hourly data on single levels from 1940 to present">13</a></sup> Europe's ERA5 reanalysis covers 1940 to today.<sup class="cite"><a href="https://cds.climate.copernicus.eu/datasets/reanalysis-era5-single-levels" rel="noopener" title="Copernicus Climate Data Store: ERA5 hourly data on single levels from 1940 to present">13</a></sup> GraphCast, for example, trained on 39 years of it, from 1979 to 2017.<sup class="cite"><a href="https://arxiv.org/pdf/2212.12794" rel="noopener" title="Lam et al.: GraphCast, learning skillful medium-range global weather forecasting (Science 2023, arXiv preprint)">3</a></sup>

During training, the model sees the state of the atmosphere at one moment and learns to predict the state six or twelve hours later. It then chains those steps together to look ten or fifteen days ahead. In other words, it learns the patterns that physics produces without solving the physics equations each time.

That is why it is fast. The hard work happens once, during training, while each new forecast after that is cheap to run.

However, the model still needs a starting point. Every forecast begins from a fresh analysis of today's weather, built from satellites, balloons, aircraft, ships and ground stations. That step, called data assimilation, still comes mostly from the traditional systems. As a result, the new models depend on the old ones in two ways: they learned from their history, and they start from their analysis.

## Why speed matters: more runs, more often, closer to home

A faster forecast is not just a cheaper forecast, because speed changes what forecasters can do.

<figure class="bfig"><img src="/media/blog-ai-weather-forecasting-ensemble-20261025.jpg" alt="Copper globe on a stand circled by many blueprint globes, one of them solid copper" width="1600" height="893" loading="lazy"><figcaption><b>Figure 1.</b> An ensemble is many possible futures run side by side. Only one will happen, and the spread shows how sure the forecast is. Illustration: SAVRN.</figcaption></figure>

First, speed allows more runs. One forecast gives you one answer. By contrast, an ensemble runs the forecast many times with small changes, which shows the range of what could happen.<sup class="cite"><a href="https://deepmind.google/discover/blog/gencast-predicts-weather-and-the-risks-of-extreme-conditions-with-sota-accuracy/" rel="noopener" title="Google DeepMind: GenCast predicts weather and the risks of extreme conditions, December 4, 2024">4</a></sup> If 40 of 51 runs bring heavy rain to your county, you can act with more confidence than if 10 do. For example, NOAA's new hybrid system combines 31 physics runs and 31 AI runs into a 62-member "grand ensemble."<sup class="cite"><a href="https://www.noaa.gov/news-release/noaa-deploys-new-generation-of-ai-driven-global-weather-models" rel="noopener" title="NOAA: NOAA deploys new generation of AI-driven global weather models, December 17, 2025">5</a></sup>

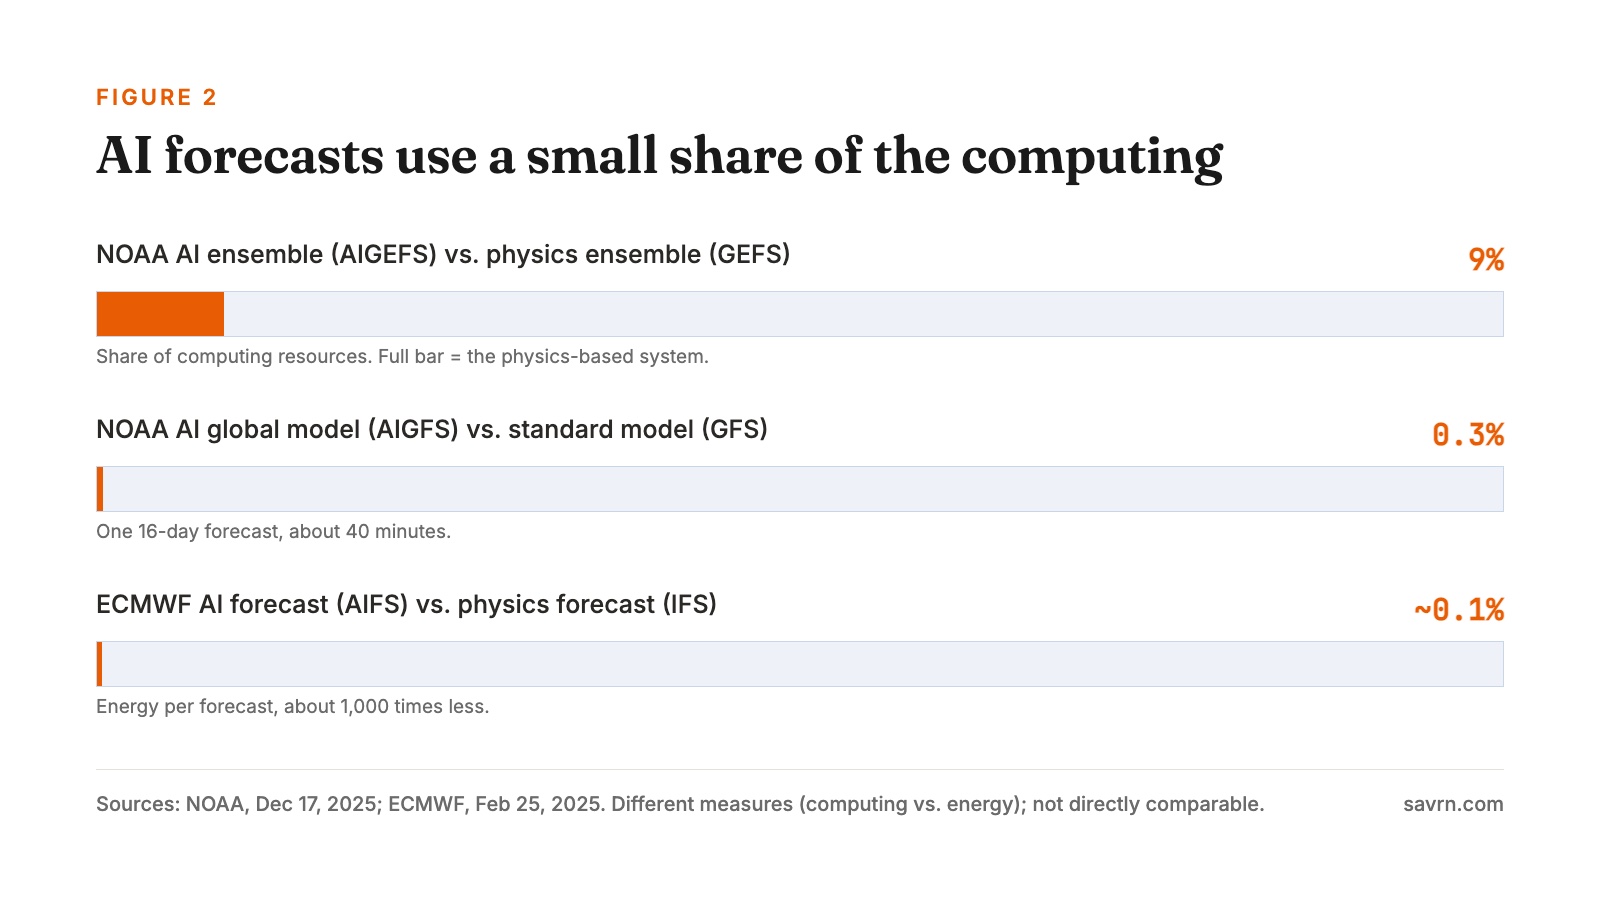
Second, speed allows more frequent updates. NOAA says one 16-day AI forecast uses only 0.3% of the computing of its standard global model.<sup class="cite"><a href="https://www.noaa.gov/news-release/noaa-deploys-new-generation-of-ai-driven-global-weather-models" rel="noopener" title="NOAA: NOAA deploys new generation of AI-driven global weather models, December 17, 2025">5</a></sup> That forecast finishes in about 40 minutes, while its AI ensemble needs 9% of the computing of the physics ensemble.<sup class="cite"><a href="https://www.noaa.gov/news-release/noaa-deploys-new-generation-of-ai-driven-global-weather-models" rel="noopener" title="NOAA: NOAA deploys new generation of AI-driven global weather models, December 17, 2025">5</a></sup> Similarly, ECMWF says its AI forecast uses about 1,000 times less energy.<sup class="cite"><a href="https://www.ecmwf.int/en/about/media-centre/news/2025/ecmwfs-ai-forecasts-become-operational" rel="noopener" title="ECMWF: ECMWF&#x27;s AI forecasts become operational, February 25, 2025">6</a></sup>

<figure class="bfig"><img src="/media/blog-ai-weather-forecasting-compute-20261025.jpg" alt="Bar chart of computing used by AI weather forecasts as a share of physics-based forecasts" width="1600" height="900" loading="lazy"><figcaption><b>Figure 2.</b> Computing or energy used by AI forecasts, as a share of the physics-based system each replaces or joins. Sources: NOAA, ECMWF. Chart: SAVRN.</figcaption></figure>

Third, speed allows local detail. For example, NOAA's research version of a storm-scale model, called WoFSCast, produced an 18-member, 6-hour thunderstorm forecast in about 30 seconds on one graphics chip.<sup class="cite"><a href="https://epic.noaa.gov/wofscast-a-graphcast-based-emulator-for-the-warn-on-forecast-system/" rel="noopener" title="NOAA EPIC: WoFSCast, a GraphCast-based emulator for the Warn-on-Forecast System, January 9, 2025">14</a></sup> By contrast, the physics system it copies needs about 10 minutes on roughly 1,100 processors.<sup class="cite"><a href="https://epic.noaa.gov/wofscast-a-graphcast-based-emulator-for-the-warn-on-forecast-system/" rel="noopener" title="NOAA EPIC: WoFSCast, a GraphCast-based emulator for the Warn-on-Forecast System, January 9, 2025">14</a></sup> That gap is the difference between a forecast that arrives in time and one that arrives late.

## What the models still get wrong

There is a catch, and it matters most when the weather is worst. Because an AI model learns from the past, it is weakest at events the past rarely contained.

In 2026, researchers tested leading AI models against ECMWF's physics model on record-breaking heat, cold and wind.<sup class="cite"><a href="https://www.kit.edu/kit/english/pi_2026_040_physics-based-weather-models-more-reliable-than-ai-for-extreme-events.php" rel="noopener" title="Karlsruhe Institute of Technology: Physics-based weather models more reliable than AI for extreme events, May 4, 2026">15</a></sup> The AI models, including GraphCast, Pangu-Weather and FuXi, trained on data from 1979 to 2017.<sup class="cite"><a href="https://www.unige.ch/medias/en/2026/lia-demunie-pour-predire-les-phenomenes-meteorologiques-extremes" rel="noopener" title="University of Geneva: AI falls short in predicting weather extremes, May 4, 2026">16</a></sup> The researchers then tested them on records set in 2018 and 2020.<sup class="cite"><a href="https://www.science.org/doi/10.1126/sciadv.aec1433" rel="noopener" title="Zhang and Engelke: Physics-based models outperform AI weather forecasts of record-breaking extremes, Science Advances, 2026">17</a></sup> The physics model did better on records at nearly every lead time.<sup class="cite"><a href="https://www.science.org/doi/10.1126/sciadv.aec1433" rel="noopener" title="Zhang and Engelke: Physics-based models outperform AI weather forecasts of record-breaking extremes, Science Advances, 2026">17</a></sup> In addition, the AI models underestimated both how often records happen and how extreme they get.<sup class="cite"><a href="https://www.kit.edu/kit/english/pi_2026_040_physics-based-weather-models-more-reliable-than-ai-for-extreme-events.php" rel="noopener" title="Karlsruhe Institute of Technology: Physics-based weather models more reliable than AI for extreme events, May 4, 2026">15</a></sup>

This does not cancel the gains, since on ordinary days the AI models are excellent. However, a forecast that is right on average can still miss the one afternoon that floods a town. For that reason, the public weather centers run both methods, compare them, and keep human forecasters in charge of warnings.

For anyone using these forecasts, the lesson is simple. Trust the range rather than a single run. Watch the extremes closely. Finally, when official warnings and an app disagree, follow the official warning.

## Storms: the first hurricane season with AI in the room

The 2025 hurricane season was the first time the National Hurricane Center used AI-based models in real-time operations. In particular, the center called the early results promising and said the Google DeepMind model "was very useful."<sup class="cite"><a href="https://www.nhc.noaa.gov/pdf/NHC_Verification_Report_2025_Preview.pdf" rel="noopener" title="National Hurricane Center: 2025 Verification Report Preview">2</a></sup>

The center's full report is careful. Overall, official forecasts beat most models. However, the Google DeepMind ensemble mean slightly outperformed the official Atlantic track forecast at 12 to 72 hours.<sup class="cite"><a href="https://www.nhc.noaa.gov/verification/pdfs/Verification_2025.pdf" rel="noopener" title="National Hurricane Center: Forecast Verification Report, 2025 Hurricane Season, March 30, 2026">7</a></sup> In the eastern Pacific, it did even better, beating the official forecast and every consensus aid from 48 to 120 hours.<sup class="cite"><a href="https://www.nhc.noaa.gov/verification/pdfs/Verification_2025.pdf" rel="noopener" title="National Hurricane Center: Forecast Verification Report, 2025 Hurricane Season, March 30, 2026">7</a></sup>

Meanwhile, the long trend still matters most. Over the past couple of decades, hurricane track errors at 24 to 72 hours fell by about 75%.<sup class="cite"><a href="https://www.nhc.noaa.gov/verification/pdfs/Verification_2025.pdf" rel="noopener" title="National Hurricane Center: Forecast Verification Report, 2025 Hurricane Season, March 30, 2026">7</a></sup> In 2025, average Atlantic track errors ranged from 20 nautical miles at 12 hours to 162 nautical miles at 5 days.<sup class="cite"><a href="https://www.nhc.noaa.gov/verification/pdfs/Verification_2025.pdf" rel="noopener" title="National Hurricane Center: Forecast Verification Report, 2025 Hurricane Season, March 30, 2026">7</a></sup> AI did not create that progress. Rather, it is the newest tool in a long line of improvements.

Melissa showed what that means on the ground. The center's report says AI ensembles have "increased forecasters' confidence to issue more aggressive intensity forecasts."<sup class="cite"><a href="https://www.nhc.noaa.gov/pdf/NHC_Verification_Report_2025_Preview.pdf" rel="noopener" title="National Hurricane Center: 2025 Verification Report Preview">2</a></sup> It also names Melissa as a strong example. Because the intensity forecast was both aggressive and correct three days out, people in Jamaica had time to prepare.

The tools keep improving. In August 2026, Google DeepMind released its WeatherNext cyclone model as open source. The company says it adds more than a full day of lead time.<sup class="cite"><a href="https://deepmind.google/blog/weathernext-ai-model-achieves-breakthrough-in-forecasting-cyclones/" rel="noopener" title="Google DeepMind: WeatherNext AI model achieves breakthrough in forecasting cyclones, August 6, 2026">18</a></sup> In addition, it can run a 1,000-member ensemble to map local odds of hurricane-force winds.<sup class="cite"><a href="https://deepmind.google/blog/weathernext-ai-model-achieves-breakthrough-in-forecasting-cyclones/" rel="noopener" title="Google DeepMind: WeatherNext AI model achieves breakthrough in forecasting cyclones, August 6, 2026">18</a></sup> Since those are the company's own claims, the next verification report will show how they hold up.

## Getting crews in place before the wind arrives

A forecast only helps if someone acts on it. Electric utilities are a good example, because their work starts before the storm.

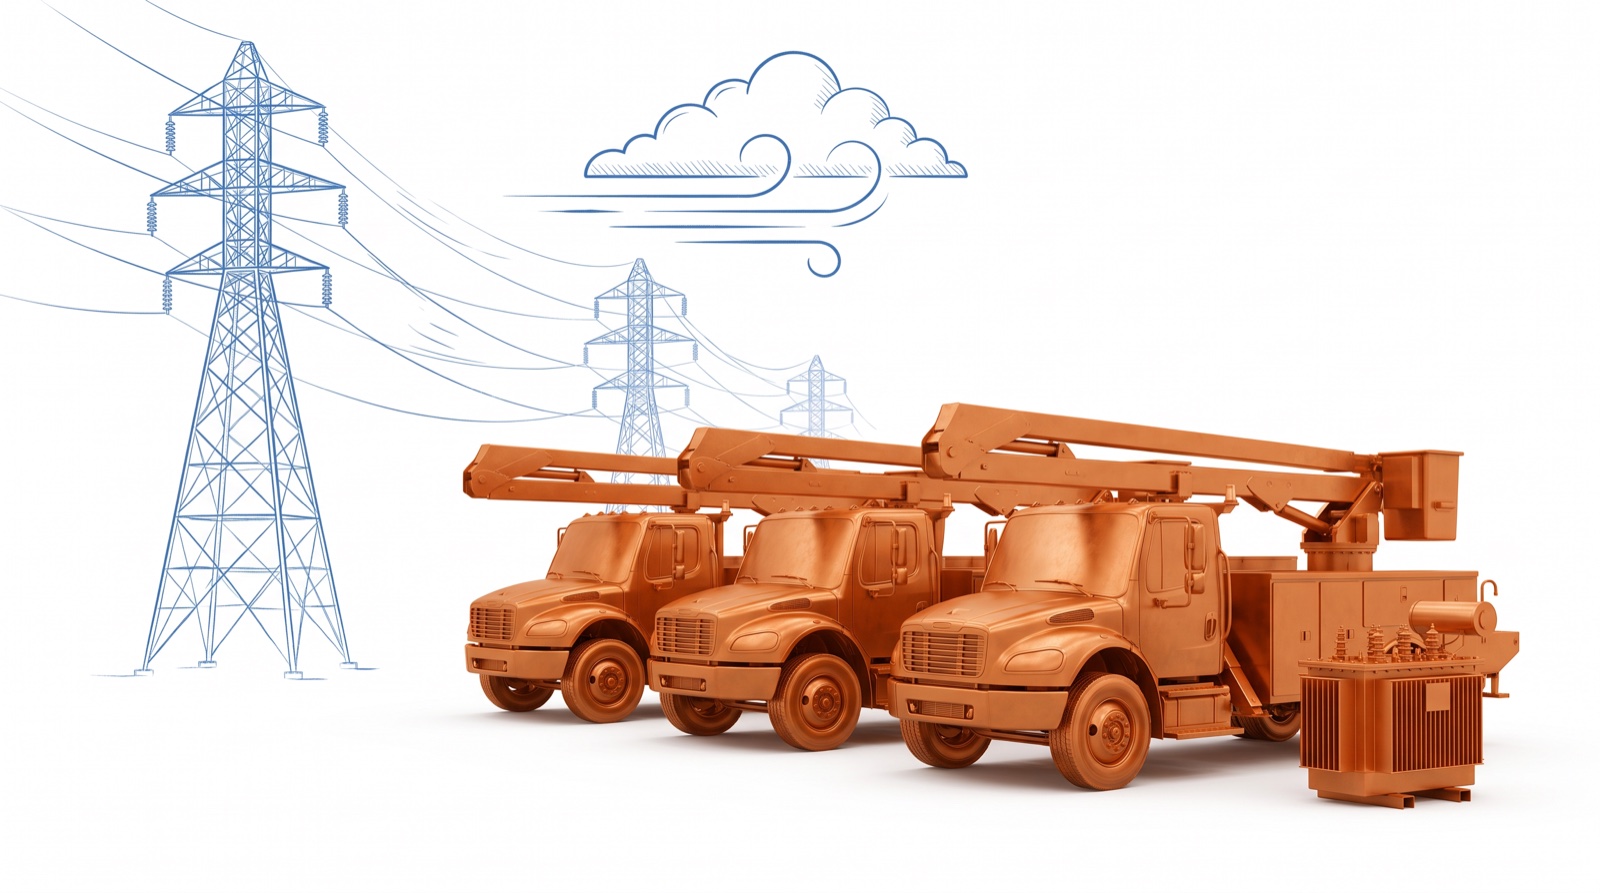
<figure class="bfig"><img src="/media/blog-ai-weather-forecasting-crews-20261025.jpg" alt="Three copper bucket trucks and a transformer staged beside blueprint power lines under a storm cloud" width="1600" height="893" loading="lazy"><figcaption><b>Figure 3.</b> Outage forecasts turn a weather forecast into a staging plan: how many crews, where, and when. Illustration: SAVRN.</figcaption></figure>

In New England, for example, the University of Connecticut built an outage prediction model with Eversource. It gives the utility a picture of a storm's likely damage up to three days ahead.<sup class="cite"><a href="https://www.eversource.uconn.edu/predicting-outages" rel="noopener" title="UConn Eversource Energy Center: Predicting Outages">19</a></sup> Because the picture updates every six hours, crews can be pre-staged and moved as the storm changes. About 3.6 million electric and gas customers benefit from it.<sup class="cite"><a href="https://www.eversource.uconn.edu/predicting-outages" rel="noopener" title="UConn Eversource Energy Center: Predicting Outages">19</a></sup> In Connecticut, more than 90% of storm outages involve trees, so the model links wind and rain forecasts to the places where trees meet wires.<sup class="cite"><a href="https://www.eversource.uconn.edu/predicting-outages" rel="noopener" title="UConn Eversource Energy Center: Predicting Outages">19</a></sup>

In short, the weather forecast becomes a staffing plan. A better forecast moves trucks to the right towns before the roads close. As a result, restoration starts hours earlier, and fewer people sit in the dark.

## Floods and the last mile

Flooding shows both the promise and the gap. On the promise side, Google's flood forecasting covers about 2 billion people in more than 150 countries.<sup class="cite"><a href="https://sites.research.google/floodforecasting" rel="noopener" title="Google Research: Flood Forecasting">20</a></sup> Its river flood forecasts reach up to seven days ahead.<sup class="cite"><a href="https://sites.research.google/floodforecasting" rel="noopener" title="Google Research: Flood Forecasting">20</a></sup> In the United States, the National Weather Service's flood inundation maps show street-level flooding. In particular, coverage grew from 10% of the population in 2023 to a planned 60% in 2025, with full national coverage planned for 2026.<sup class="cite"><a href="https://www.weather.gov/news/242509-flood-inundation-map" rel="noopener" title="National Weather Service: Flood Inundation Mapping">21</a></sup>

Flash floods are harder because they build in minutes. Even so, a NASA and NOAA machine learning tool captured 93% of issued flash-flood warnings in simulations of 2017 to 2023.<sup class="cite"><a href="https://science.nasa.gov/science-research/science-enabling-technology/nasa-uses-machine-learning-to-enhance-flash-flood-warnings/" rel="noopener" title="NASA Science: NASA uses machine learning to enhance flash flood warnings, June 23, 2026">22</a></sup> It also produced forecasts in as little as 15 minutes. However, these are simulation results, and the Weather Service is still adding the tool to its Southern California flash-flood systems.<sup class="cite"><a href="https://science.nasa.gov/science-research/science-enabling-technology/nasa-uses-machine-learning-to-enhance-flash-flood-warnings/" rel="noopener" title="NASA Science: NASA uses machine learning to enhance flash flood warnings, June 23, 2026">22</a></sup>

On the gap side, a warning that people cannot read does not help them. For years, bilingual forecasters spent up to an hour translating a single product. Now, however, an AI system does some translations in 5 to 7 minutes. Since the 2025 season, the National Hurricane Center has issued AI-translated Spanish advisories.<sup class="cite"><a href="https://las.illinois.edu/news/2026-06-05/researchers-advance-first-its-kind-ai-tool-translating-life-saving-weather-warnings-across-us" rel="noopener" title="University of Illinois: AI tool for translating weather warnings, June 5, 2026">23</a></sup>

People matter too. In 2025, the Weather Service lost about 550 staff through firings, resignations and early retirements. As a result, one office in Goodland, Kansas, missing eight meteorologists, stopped round-the-clock operations.<sup class="cite"><a href="https://www.bostonglobe.com/2025/12/06/nation/national-weather-service-winter-staffing" rel="noopener" title="Boston Globe: National Weather Service winter staffing, December 6, 2025">24</a></sup> AI can speed up some tasks. However, it cannot replace the forecaster who calls the county emergency manager at 2 a.m.

The value of getting this right is large. The United Nations notes that 24 hours' notice of a hazard can cut economic damage by 30%.<sup class="cite"><a href="https://www.un.org/sites/un2.un.org/files/2025-12-02-fast-facts/EarlyWarnings_FastFacts.pdf" rel="noopener" title="United Nations: Fast Facts, Early Warnings for All, December 2025">8</a></sup> Meanwhile, the United States had 23 billion-dollar weather and climate disasters in 2025.<sup class="cite"><a href="https://www.climatecentral.org/report/us-billion-dollar-weather-and-climate-disasters-2025" rel="noopener" title="Climate Central: U.S. Billion-Dollar Weather and Climate Disasters, 2025, March 9, 2026">9</a></sup> Together they cost about $115.0 billion and killed 276 people.<sup class="cite"><a href="https://www.climatecentral.org/report/us-billion-dollar-weather-and-climate-disasters-2025" rel="noopener" title="Climate Central: U.S. Billion-Dollar Weather and Climate Disasters, 2025, March 9, 2026">9</a></sup>

## Farming: the spray window is a weather decision

Now consider a farmer, because farming may be the most weather-dependent business there is. Many farm decisions are timing decisions, and timing depends on a forecast.

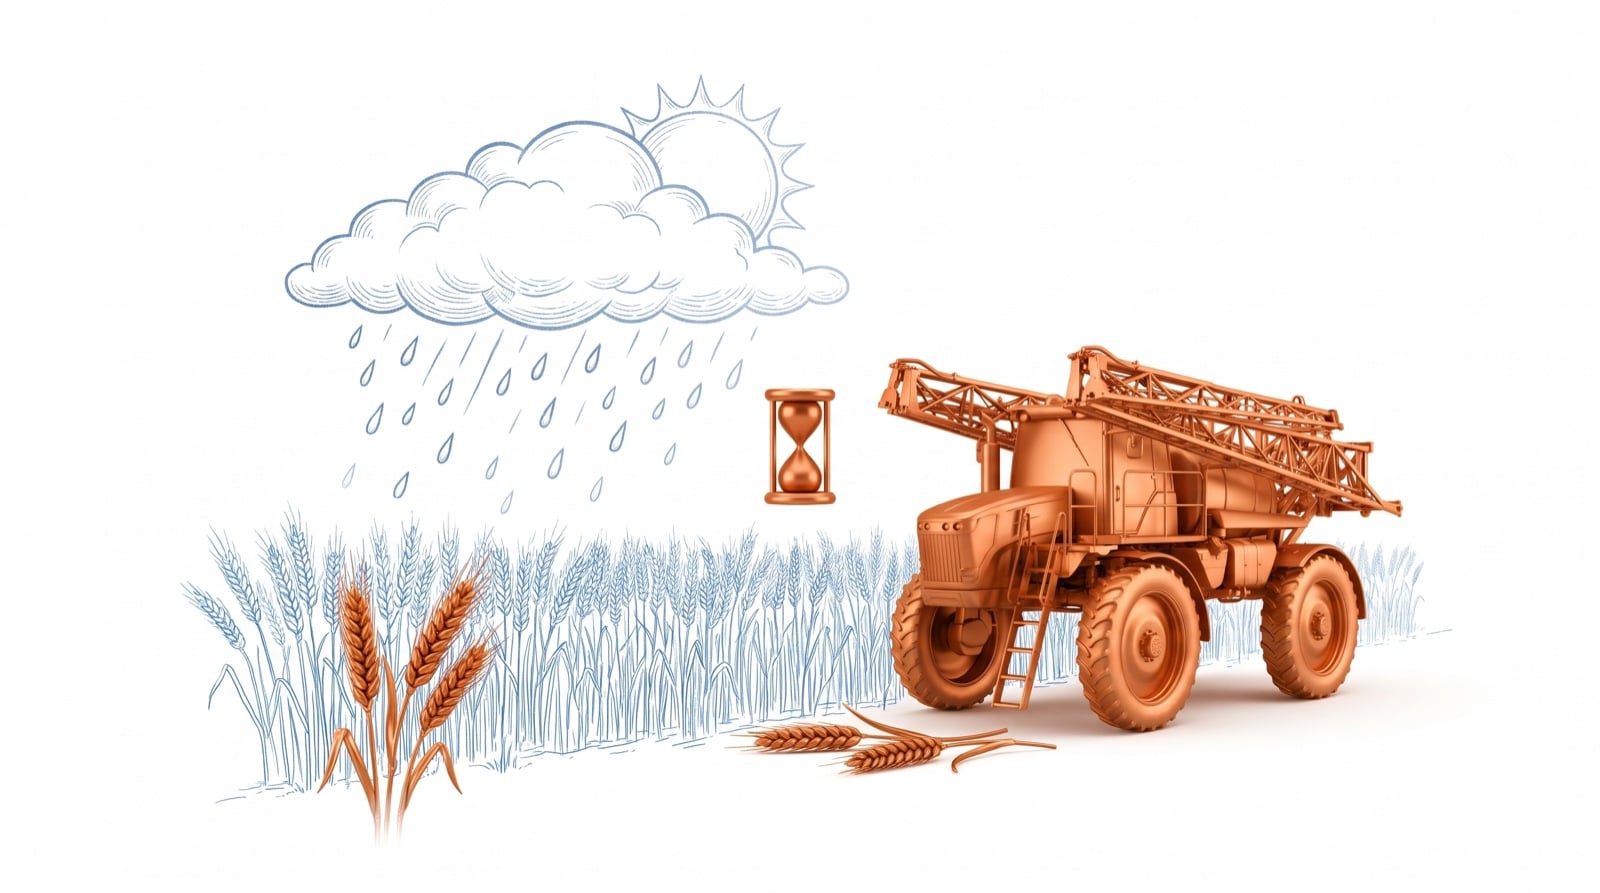
<figure class="bfig"><img src="/media/blog-ai-weather-forecasting-spray-window-20261025.jpg" alt="Copper crop sprayer and wheat heads beside a blueprint rain cloud with an hourglass between them" width="1600" height="893" loading="lazy"><figcaption><b>Figure 4.</b> A fungicide pass works only inside a narrow window set by crop stage, rain and wind. Illustration: SAVRN.</figcaption></figure>

Take wheat and a disease called Fusarium head blight, or scab. It thrives during three or more days of frequent rain, or relative humidity above 90%, with temperatures between 59 and 86°F.<sup class="cite"><a href="https://news.utcrops.com/?p=17859" rel="noopener" title="UT Crops News: Wheat in bloom, check your scab risk, May 1, 2019">10</a></sup> For that reason, risk models use the weather from the seven days before flowering to estimate scab risk. University of Tennessee Extension reports these models have been correct about 75% of the time.<sup class="cite"><a href="https://news.utcrops.com/?p=17859" rel="noopener" title="UT Crops News: Wheat in bloom, check your scab risk, May 1, 2019">10</a></sup>

The timing is tight. Fungicide works best at early flowering, while sprays up to five or six days after first bloom still help. By contrast, sprays at the flag-leaf stage do not control scab.<sup class="cite"><a href="https://news.utcrops.com/?p=17859" rel="noopener" title="UT Crops News: Wheat in bloom, check your scab risk, May 1, 2019">10</a></sup> When timed well, fungicides cut symptoms and toxins by about 40% to 60% compared with no spray.<sup class="cite"><a href="https://news.utcrops.com/?p=17859" rel="noopener" title="UT Crops News: Wheat in bloom, check your scab risk, May 1, 2019">10</a></sup>

The cost is real too. For example, a 2026 University of Nebraska–Lincoln dryland wheat budget lists aerial application at $11.00 per acre.<sup class="cite"><a href="https://cap.unl.edu/sites/unl.edu.ianr.agecon.center-for-ag-profitability/files/media/file/%23079%20Wheat%2C%20Dryland%2C%20Southwest%2C%20No%20Till%2C%20Wheat%20before%20Corn%2C%20Two%20Crops%20in%20Three%20Years_2026.pdf" rel="noopener" title="University of Nebraska–Lincoln: 2026 Crop Budget #079, dryland wheat">25</a></sup> With the budget's foliar fungicide, about $19 of product, one pass costs roughly $30 per treated acre.<sup class="cite"><a href="https://cap.unl.edu/sites/unl.edu.ianr.agecon.center-for-ag-profitability/files/media/file/%23079%20Wheat%2C%20Dryland%2C%20Southwest%2C%20No%20Till%2C%20Wheat%20before%20Corn%2C%20Two%20Crops%20in%20Three%20Years_2026.pdf" rel="noopener" title="University of Nebraska–Lincoln: 2026 Crop Budget #079, dryland wheat">25</a></sup> Scab-labeled products are priced separately. Therefore, a better 48-hour forecast is worth money on every acre the grower does not need to spray, and on every acre sprayed at the right moment.

Other crops follow the same pattern:

- **Corn tar spot.** U.S. farmers lost about 5 million metric tons of corn to tar spot in 2018, around $680 million. In response, Wisconsin researchers built the Tarspotter app after studying links between the disease and more than 100 environmental factors.<sup class="cite"><a href="https://grow.cals.wisc.edu/priority-themes/food-systems-priority-theme/this-app-hits-the-tar-spot" rel="noopener" title="UW–Madison CALS Grow: This app hits the tar spot, Summer 2024">26</a></sup>
- **Soybean white mold.** The Sporecaster app predicts when the fungus will appear using weather data. It has an accuracy rating of 81.8%, and the best spray time is during flowering.<sup class="cite"><a href="https://cropprotectionnetwork.org/news/smartphone-application-to-forecast-white-mold-in-soybean-now-available-to-growers" rel="noopener" title="Crop Protection Network: Sporecaster app for white mold in soybean, March 19, 2019">27</a></sup>
- **Peanut leaf spot.** In North Carolina, daily advisories built from the state's ECONet weather stations saved one to two fungicide sprays at most locations in 2005. That was a potential saving of up to $2.2 million.<sup class="cite"><a href="https://ams.confex.com/ams/pdfpapers/103912.pdf" rel="noopener" title="NC State Climate Office: Weather and Climate Decision Support Tools for Agricultural Applications (AMS paper)">28</a></sup> Left alone, in fact, leaf spot can cut yields by 50% or more.<sup class="cite"><a href="https://ams.confex.com/ams/pdfpapers/103912.pdf" rel="noopener" title="NC State Climate Office: Weather and Climate Decision Support Tools for Agricultural Applications (AMS paper)">28</a></sup>

Then comes the spray day itself. Rain, wind and air temperature all decide whether a pass works:

- **Rain.** Many fungicides hold up when one inch of rain falls 24 hours after spraying. However, two inches or more within 24 hours generally means spraying again.<sup class="cite"><a href="https://ipm.missouri.edu/MEG/2018/3/rainfastness_pesticides/" rel="noopener" title="University of Missouri IPM: Rainfastness of pesticides, March 28, 2018">29</a></sup>
- **Wind.** Minnesota guidance says not to spray herbicide when wind is below 3 mph or above 10 mph.<sup class="cite"><a href="https://www.mda.state.mn.us/sites/default/files/docs/2026-04/herbdriftmgmt_0.pdf" rel="noopener" title="Minnesota Department of Agriculture: Herbicide Drift Management card (2020)">30</a></sup>
- **Inversions.** A calm, clear evening with dew, ground fog or smoke that drifts sideways signals a temperature inversion. Because cool air is trapped near the ground, spray can then drift far from the field.<sup class="cite"><a href="https://www.mda.state.mn.us/sites/default/files/docs/2026-04/herbdriftmgmt_0.pdf" rel="noopener" title="Minnesota Department of Agriculture: Herbicide Drift Management card (2020)">30</a></sup>

Therefore, the real spray window is the few hours that pass all three tests. Finding those hours is exactly what a sharp local forecast is for.

## Planting, frost and harvest

Forecasts shape the rest of the farm year as well. Researchers at Colorado State University collected several measured examples. In the 1960s, for instance, rain forecasts were worth about $20 million a year to raisin growers, or about $206 million in today's dollars.<sup class="cite"><a href="https://www.cira.colostate.edu/science-stories/by-the-numbers-forecast-benefits-to-agriculture/" rel="noopener" title="CIRA, Colorado State University: By the numbers, forecast benefits to agriculture, March 2025">31</a></sup> For lettuce, rain forecasts that guide irrigation are worth about $1,000 per hectare per year, or about $24 million a year.<sup class="cite"><a href="https://www.cira.colostate.edu/science-stories/by-the-numbers-forecast-benefits-to-agriculture/" rel="noopener" title="CIRA, Colorado State University: By the numbers, forecast benefits to agriculture, March 2025">31</a></sup> Similarly, better smoke forecasts are worth $0.8 million to $1.6 million a year to the wine industry.<sup class="cite"><a href="https://www.cira.colostate.edu/science-stories/by-the-numbers-forecast-benefits-to-agriculture/" rel="noopener" title="CIRA, Colorado State University: By the numbers, forecast benefits to agriculture, March 2025">31</a></sup>

AI is already reaching farmers at scale. In 2025, 38 million farmers in India received AI-powered forecasts of the monsoon's start.<sup class="cite"><a href="https://blog.google/technology/research/indian-farmers-monsoon-prediction/" rel="noopener" title="Google: AI monsoon forecasts for Indian farmers, September 15, 2025">11</a></sup> The forecasts drew in part on Google's NeuralGCM model and ECMWF's AI model. In particular, they predicted the monsoon's onset up to a month ahead and caught an unusual dry spell.<sup class="cite"><a href="https://blog.google/technology/research/indian-farmers-monsoon-prediction/" rel="noopener" title="Google: AI monsoon forecasts for Indian farmers, September 15, 2025">11</a></sup> As a result, farmers could decide when to plant, whether to buy more seed, or whether to wait.<sup class="cite"><a href="https://blog.google/technology/research/indian-farmers-monsoon-prediction/" rel="noopener" title="Google: AI monsoon forecasts for Indian farmers, September 15, 2025">11</a></sup>

The stakes keep rising. In 2024, U.S. crop and rangeland losses from major weather events and fires exceeded $20.3 billion.<sup class="cite"><a href="https://www.fb.org/market-intel/hurricanes-heat-and-hardship-counting-2024s-crop-losses" rel="noopener" title="American Farm Bureau Federation: Counting 2024&#x27;s crop losses, February 18, 2025">32</a></sup> Drought, heat and wildfire alone, in fact, caused over $11 billion of those losses.<sup class="cite"><a href="https://www.fb.org/market-intel/hurricanes-heat-and-hardship-counting-2024s-crop-losses" rel="noopener" title="American Farm Bureau Federation: Counting 2024&#x27;s crop losses, February 18, 2025">32</a></sup>

<div class="btab"><div class="btab-cap"><b>Table 1</b> Decisions a better forecast moves earlier</div><div class="brows"><div class="br"><span class="br-k">Coastal community: evacuate, open shelters</span><span class="br-v">~3 days</span><span class="br-b">Melissa Category 5 notice <sup class="cite"><a href="https://www.nhc.noaa.gov/pdf/NHC_Verification_Report_2025_Preview.pdf" rel="noopener" title="National Hurricane Center: 2025 Verification Report Preview">2</a></sup></span></div><div class="br"><span class="br-k">Utility: stage repair crews</span><span class="br-v">up to 3 days</span><span class="br-b">updated every 6 hours <sup class="cite"><a href="https://www.eversource.uconn.edu/predicting-outages" rel="noopener" title="UConn Eversource Energy Center: Predicting Outages">19</a></sup></span></div><div class="br"><span class="br-k">Wheat grower: fungicide at flowering</span><span class="br-v">~$30/acre</span><span class="br-b">one aerial pass per treated acre, UNL 2026 <sup class="cite"><a href="https://cap.unl.edu/sites/unl.edu.ianr.agecon.center-for-ag-profitability/files/media/file/%23079%20Wheat%2C%20Dryland%2C%20Southwest%2C%20No%20Till%2C%20Wheat%20before%20Corn%2C%20Two%20Crops%20in%20Three%20Years_2026.pdf" rel="noopener" title="University of Nebraska–Lincoln: 2026 Crop Budget #079, dryland wheat">25</a></sup></span></div><div class="br"><span class="br-k">Peanut grower: skip unneeded sprays</span><span class="br-v">1–2 sprays</span><span class="br-b">saved per season, NC 2005 <sup class="cite"><a href="https://ams.confex.com/ams/pdfpapers/103912.pdf" rel="noopener" title="NC State Climate Office: Weather and Climate Decision Support Tools for Agricultural Applications (AMS paper)">28</a></sup></span></div><div class="br"><span class="br-k">Grid operator: schedule wind power</span><span class="br-v">~20%</span><span class="br-b">more value from wind <sup class="cite"><a href="https://deepmind.google/discover/blog/machine-learning-can-boost-the-value-of-wind-energy/" rel="noopener" title="DeepMind: Machine learning can boost the value of wind energy, February 26, 2019">33</a></sup></span></div><div class="br"><span class="br-k">Power plant: plan for heat derate</span><span class="br-v">5–10%</span><span class="br-b">output lost per 10°C <sup class="cite"><a href="https://www.wartsila.com/energy/learn-more/technology-comparison-engines-vs-aeros/derating-due-to-ambient-temperature" rel="noopener" title="Wärtsilä: Derating due to ambient temperature">34</a></sup></span></div><div class="br"><span class="br-k">Airline: reroute around storms</span><span class="br-v">74.26%</span><span class="br-b">of FAA delays caused by weather <sup class="cite"><a href="https://www.faa.gov/nextgen/programs/weather/faq" rel="noopener" title="FAA: Weather delay FAQ">35</a></sup></span></div></div></div>

## Energy: the grid runs on the forecast

Power systems are weather systems. Demand rises with heat and cold, while wind and solar output follow the sky.

Texas shows both sides. ERCOT set an all-time demand record of 91,089 megawatts on July 22, 2026, although ERCOT lists it as unofficial until final settlement.<sup class="cite"><a href="https://www.ercot.com/static-assets/data/news/content/a-peak-demand/all-time-records.htm" rel="noopener" title="ERCOT: Yearly peak demand records">36</a></sup> In February 2021, by contrast, Winter Storm Uri forced 23,418 megawatts of manual load shedding across the affected grids. It was the largest controlled load shed in U.S. history.<sup class="cite"><a href="https://www.nerc.com/pa/rrm/ea/Documents/February_2021_Cold_Weather_Report.pdf" rel="noopener" title="FERC, NERC and Regional Entity staff: The February 2021 Cold Weather Outages in Texas and the South Central United States, November 2021">37</a></sup> More than 4.5 million people in Texas lost power, some for as long as four days.<sup class="cite"><a href="https://www.nerc.com/pa/rrm/ea/Documents/February_2021_Cold_Weather_Report.pdf" rel="noopener" title="FERC, NERC and Regional Entity staff: The February 2021 Cold Weather Outages in Texas and the South Central United States, November 2021">37</a></sup>

Better forecasts help grid operators plan for those days. In addition, they raise the value of clean power. In 2019, DeepMind reported on a model that predicts wind farm output 36 hours ahead across 700 megawatts in the central United States. Because the power could be scheduled in advance, the value of that wind energy rose by roughly 20%.<sup class="cite"><a href="https://deepmind.google/discover/blog/machine-learning-can-boost-the-value-of-wind-energy/" rel="noopener" title="DeepMind: Machine learning can boost the value of wind energy, February 26, 2019">33</a></sup>

For more on how grid operators are handling new demand, see our [Data Center Grid Operator Watchlist](/data-center-grid-operator-watchlist).

## What we take from weather models for AI factories

This is where the subject meets our own work. An AI factory is a building full of computers, plus its own power and cooling. In fact, every one of those systems responds to the weather.

Start with power. Gas turbines lose output as air gets hotter, because warm air is thinner. Wärtsilä, which makes competing engines, says turbines lose 5% to 10% of output for every 10°C above 15°C.<sup class="cite"><a href="https://www.wartsila.com/energy/learn-more/technology-comparison-engines-vs-aeros/derating-due-to-ambient-temperature" rel="noopener" title="Wärtsilä: Derating due to ambient temperature">34</a></sup> Here is a simple example. Take a site that relies on gas turbines rated at 13.2 megawatts at 15°C. On a 40°C afternoon, that is 25 degrees above the rating point. At 5% to 10% per 10 degrees, the site could therefore lose about 1.7 to 3.3 megawatts, right when cooling needs the most power. For that reason, a 15-day probability forecast of hot afternoons is a planning tool rather than a curiosity. In practice, however, the turbine maker's own performance curve should set the exact number.

Next comes cooling. Outside air can cool a data center for free when it is cool enough. ENERGY STAR notes that even in northern Florida, an air-side economizer can be used for about half the year.<sup class="cite"><a href="https://www.energystar.gov/products/data_center_equipment/16-more-ways-cut-energy-waste-data-center/use-air-side-economizer" rel="noopener" title="ENERGY STAR: Use an air-side economizer">38</a></sup> So the forecast tells an operator how many free-cooling hours are coming. In 2016, for example, DeepMind reported that machine learning cut the energy Google used for cooling by up to 40%.<sup class="cite"><a href="https://deepmind.google/discover/blog/deepmind-ai-reduces-google-data-centre-cooling-bill-by-40/" rel="noopener" title="DeepMind: DeepMind AI reduces Google data centre cooling bill by 40%, July 20, 2016">39</a></sup> By DeepMind's account, the old controls could not adapt quickly to changes such as the weather.<sup class="cite"><a href="https://deepmind.google/discover/blog/deepmind-ai-reduces-google-data-centre-cooling-bill-by-40/" rel="noopener" title="DeepMind: DeepMind AI reduces Google data centre cooling bill by 40%, July 20, 2016">39</a></sup>

Then there is timing. Google's data centers compare day-ahead forecasts each day and shift flexible computing to hours when low-carbon power, such as wind and solar, is most plentiful.<sup class="cite"><a href="https://blog.google/inside-google/infrastructure/data-centers-work-harder-sun-shines-wind-blows/" rel="noopener" title="Google: Our data centers now work harder when the sun shines and wind blows, April 22, 2020">40</a></sup> Training runs and batch jobs can often wait a few hours. By contrast, a hospital's power cannot.

Beyond these uses, the way weather models work teaches four lessons for running any large facility:

1. **Plan with a range, not one number.** Ensembles report odds. Likewise, a site can plan power and cooling as "90% likely between 11 and 13 megawatts" instead of one guess.
2. **Keep the model in step with the sensors.** Weather centers blend new observations into the model every few hours. Similarly, a facility model should correct itself against its own meters around the clock.
3. **Design for the record day.** The AI weather models score well on average but miss records. Because facilities fail the same way, size and test equipment against the hottest afternoon rather than the average one.
4. **Grade every forecast.** Weather centers score their forecasts against what happened, every day. In the same way, a facility that logs and checks its own predictions of load, temperature and output gets better every season, since each miss shows what to fix.

We have written more about [AI data center power efficiency](/blog/ai-data-center-power-efficiency) and [how on-site fuel cells compare with the grid on reliability](/blog/fuel-cell-vs-grid-reliability).

## Other places the forecast pays

The same pattern shows up across the economy:

- **Aviation.** Weather caused 74.26% of the FAA's system-impacting delays of more than 15 minutes from June 2017 to May 2023.<sup class="cite"><a href="https://www.faa.gov/nextgen/programs/weather/faq" rel="noopener" title="FAA: Weather delay FAQ">35</a></sup>
- **Shipping.** The International Maritime Organization puts the fuel savings from weather routing at 0.5% to 5%, depending on ship size, type and route.<sup class="cite"><a href="https://greenvoyage2050.imo.org/technology/weather-routing/" rel="noopener" title="IMO GreenVoyage2050: Weather routing">41</a></sup>
- **Wildfire.** ALERTCalifornia's AI cameras detected over 1,200 fires in their first season. In fact, they beat 911 calls more than 30% of the time.<sup class="cite"><a href="https://alertcalifornia.org/about/" rel="noopener" title="ALERTCalifornia, UC San Diego: About">42</a></sup>
- **Construction.** A 2021 study in the journal Sustainability notes that adverse weather delays 45% of construction projects worldwide.<sup class="cite"><a href="https://ideas.repec.org/a/gam/jsusta/v13y2021i5p2861-d511926.html" rel="noopener" title="Schuldt et al.: Weather-Related Construction Delays in a Changing Climate, Sustainability, 2021">43</a></sup>
- **Public health.** The CDC and NOAA HeatRisk tool gives a seven-day heat forecast nationwide, because heat at certain levels can harm health.<sup class="cite"><a href="https://www.cdc.gov/media/releases/2024/p0422-heat-protection.html" rel="noopener" title="CDC: Heat and health tools, April 22, 2024">44</a></sup>

In every case, the forecast matters because it moves a decision earlier. For instance, a flight is rerouted before it departs. A crew pours concrete on the dry day, while a cooling center opens before the heat arrives.

## How to use AI forecasts well

Whether you run a farm, a utility, a city or a data center, the same rules apply.

1. **Start with the decision.** Name the action, its cost and its deadline. For instance, "spray at early flowering if scab risk is high and no heavy rain is due within 24 hours."
2. **Use official warnings as the trigger.** For life-safety actions, the National Weather Service and local emergency managers remain the authority, while apps and AI models are guidance.
3. **Read probabilities.** A 30% chance of crossing a threshold is useful only if you have decided in advance what 30% triggers.
4. **Set thresholds by cost.** Cheap, reversible steps, such as checking pumps or calling volunteers, make sense at low odds. By contrast, expensive steps such as closing a road or evacuating need stronger evidence.
5. **Watch the extremes.** When a forecast shows record heat or an unusual storm, compare several models and lean on human forecasters.
6. **Keep score.** Write down what the forecast said, what you did, and what happened. After a season, you will know which forecasts to trust for your fields, your town or your site.

## Where this goes next

Weather forecasting improves because it gets tested against reality every single day. Few fields have a loop that tight. Since AI made the forecasts faster and cheaper, more people can now run many of them, more often, for smaller places.

That shift moves the value downstream. The global forecast is becoming a shared public good, published openly by the big centers. As a result, the advantage now goes to whoever turns that forecast into a better local decision. That might be the grower who sprays in the right four hours, or the utility that stages crews a day early. It might be the county that opens shelters before the roads flood, or the operator who plans for the hottest afternoon of the year.

The weather will keep surprising us, especially at the extremes. Even so, with good forecasts, reliable odds and clear plans, people can be ready more often than they used to be.

*Chad Everett Harris is the founder of SAVRN. Figures checked October 25, 2026. This article is general information. For an actual weather threat, follow the National Weather Service and your local emergency officials.*

<details class="bsrc">
<summary>Sources</summary>
<ol>
<li id="src-1"><a href="https://www.nhc.noaa.gov/archive/2025/al13/al132025.discus.018.shtml" rel="noopener">National Hurricane Center: Hurricane Melissa Discussion Number 18, October 25, 2025</a>; Forecasters cite Google DeepMind ensembles on continued rapid intensification</li><li id="src-2"><a href="https://www.nhc.noaa.gov/pdf/NHC_Verification_Report_2025_Preview.pdf" rel="noopener">National Hurricane Center: 2025 Verification Report Preview</a>; First season with AI models in real-time operations; Melissa forecast to reach Category 5 almost three days ahead</li><li id="src-3"><a href="https://arxiv.org/pdf/2212.12794" rel="noopener">Lam et al.: GraphCast, learning skillful medium-range global weather forecasting (Science 2023, arXiv preprint)</a>; 10-day global forecast in under one minute; better than HRES on 90% of 1,380 targets; trained on ERA5 1979–2017</li><li id="src-4"><a href="https://deepmind.google/discover/blog/gencast-predicts-weather-and-the-risks-of-extreme-conditions-with-sota-accuracy/" rel="noopener">Google DeepMind: GenCast predicts weather and the risks of extreme conditions, December 4, 2024</a>; More accurate than ECMWF ENS on 97.2% of 1,320 targets; one 15-day forecast in 8 minutes on one TPU</li><li id="src-5"><a href="https://www.noaa.gov/news-release/noaa-deploys-new-generation-of-ai-driven-global-weather-models" rel="noopener">NOAA: NOAA deploys new generation of AI-driven global weather models, December 17, 2025</a>; AIGFS uses 0.3% of GFS computing; AIGEFS 9% of GEFS; HGEFS 62-member hybrid ensemble</li><li id="src-6"><a href="https://www.ecmwf.int/en/about/media-centre/news/2025/ecmwfs-ai-forecasts-become-operational" rel="noopener">ECMWF: ECMWF&#x27;s AI forecasts become operational, February 25, 2025</a>; AIFS into operations; about 1,000 times less energy per forecast</li><li id="src-7"><a href="https://www.nhc.noaa.gov/verification/pdfs/Verification_2025.pdf" rel="noopener">National Hurricane Center: Forecast Verification Report, 2025 Hurricane Season, March 30, 2026</a>; Google DeepMind ensemble mean slightly beat official Atlantic track forecasts at 12–72 hours; track errors down about 75% over two decades</li><li id="src-8"><a href="https://www.un.org/sites/un2.un.org/files/2025-12-02-fast-facts/EarlyWarnings_FastFacts.pdf" rel="noopener">United Nations: Fast Facts, Early Warnings for All, December 2025</a>; 24 hours&#x27; notice can cut economic damage by 30%</li><li id="src-9"><a href="https://www.climatecentral.org/report/us-billion-dollar-weather-and-climate-disasters-2025" rel="noopener">Climate Central: U.S. Billion-Dollar Weather and Climate Disasters, 2025, March 9, 2026</a>; 23 billion-dollar disasters in 2025, about $115.0 billion, 276 deaths</li><li id="src-10"><a href="https://news.utcrops.com/?p=17859" rel="noopener">UT Crops News: Wheat in bloom, check your scab risk, May 1, 2019</a>; Scab risk models use weather 7 days before flowering, correct 75% of the time; spray at early flowering; 40–60% control</li><li id="src-11"><a href="https://blog.google/technology/research/indian-farmers-monsoon-prediction/" rel="noopener">Google: AI monsoon forecasts for Indian farmers, September 15, 2025</a>; 38 million farmers received AI forecasts of monsoon onset up to a month ahead</li><li id="src-12"><a href="https://www.ecmwf.int/en/about/media-centre/news/2025/ecmwfs-ensemble-ai-forecasts-become-operational" rel="noopener">ECMWF: ECMWF&#x27;s ensemble AI forecasts become operational, July 1, 2025</a>; 51-member AI ensemble, over 10 times faster than the physics-based system</li><li id="src-13"><a href="https://cds.climate.copernicus.eu/datasets/reanalysis-era5-single-levels" rel="noopener">Copernicus Climate Data Store: ERA5 hourly data on single levels from 1940 to present</a>; What a reanalysis is; ERA5 data available from 1940</li><li id="src-14"><a href="https://epic.noaa.gov/wofscast-a-graphcast-based-emulator-for-the-warn-on-forecast-system/" rel="noopener">NOAA EPIC: WoFSCast, a GraphCast-based emulator for the Warn-on-Forecast System, January 9, 2025</a>; 18-member, 6-hour storm forecast in about 30 seconds on one GPU</li><li id="src-15"><a href="https://www.kit.edu/kit/english/pi_2026_040_physics-based-weather-models-more-reliable-than-ai-for-extreme-events.php" rel="noopener">Karlsruhe Institute of Technology: Physics-based weather models more reliable than AI for extreme events, May 4, 2026</a>; Summary of Zhang and Engelke, Science Advances 2026, on record heat, cold and wind</li><li id="src-16"><a href="https://www.unige.ch/medias/en/2026/lia-demunie-pour-predire-les-phenomenes-meteorologiques-extremes" rel="noopener">University of Geneva: AI falls short in predicting weather extremes, May 4, 2026</a>; Training period 1979–2017; record events tested in 2018 and 2020</li><li id="src-17"><a href="https://www.science.org/doi/10.1126/sciadv.aec1433" rel="noopener">Zhang and Engelke: Physics-based models outperform AI weather forecasts of record-breaking extremes, Science Advances, 2026</a>; Record heat, cold and wind in test years 2018 and 2020; HRES better across nearly all lead times</li><li id="src-18"><a href="https://deepmind.google/blog/weathernext-ai-model-achieves-breakthrough-in-forecasting-cyclones/" rel="noopener">Google DeepMind: WeatherNext AI model achieves breakthrough in forecasting cyclones, August 6, 2026</a>; Company claim of more than 24 hours of added lead time; 1,000-member wind probability maps; model open sourced</li><li id="src-19"><a href="https://www.eversource.uconn.edu/predicting-outages" rel="noopener">UConn Eversource Energy Center: Predicting Outages</a>; Outage Prediction Model, up to three days ahead, updated every six hours; 3.6 million customers</li><li id="src-20"><a href="https://sites.research.google/floodforecasting" rel="noopener">Google Research: Flood Forecasting</a>; AI flood forecasts covering 2 billion people in over 150 countries; riverine floods up to 7 days ahead</li><li id="src-21"><a href="https://www.weather.gov/news/242509-flood-inundation-map" rel="noopener">National Weather Service: Flood Inundation Mapping</a>; FIM from 10% of the population in 2023 to 60% in 2025</li><li id="src-22"><a href="https://science.nasa.gov/science-research/science-enabling-technology/nasa-uses-machine-learning-to-enhance-flash-flood-warnings/" rel="noopener">NASA Science: NASA uses machine learning to enhance flash flood warnings, June 23, 2026</a>; Captured 93% of issued flash-flood warnings in 2017–2023 simulations; forecasts in about 15 minutes</li><li id="src-23"><a href="https://las.illinois.edu/news/2026-06-05/researchers-advance-first-its-kind-ai-tool-translating-life-saving-weather-warnings-across-us" rel="noopener">University of Illinois: AI tool for translating weather warnings, June 5, 2026</a>; Translation time from up to an hour to 5–7 minutes for some products; AI-translated Spanish NHC advisories from 2025</li><li id="src-24"><a href="https://www.bostonglobe.com/2025/12/06/nation/national-weather-service-winter-staffing" rel="noopener">Boston Globe: National Weather Service winter staffing, December 6, 2025</a>; About 550 departures; 184 positions advertised; Goodland, Kansas halted 24-hour forecasts</li><li id="src-25"><a href="https://cap.unl.edu/sites/unl.edu.ianr.agecon.center-for-ag-profitability/files/media/file/%23079%20Wheat%2C%20Dryland%2C%20Southwest%2C%20No%20Till%2C%20Wheat%20before%20Corn%2C%20Two%20Crops%20in%20Three%20Years_2026.pdf" rel="noopener">University of Nebraska–Lincoln: 2026 Crop Budget #079, dryland wheat</a>; Aerial spray $11.00 per acre; fungicide product price</li><li id="src-26"><a href="https://grow.cals.wisc.edu/priority-themes/food-systems-priority-theme/this-app-hits-the-tar-spot" rel="noopener">UW–Madison CALS Grow: This app hits the tar spot, Summer 2024</a>; About 5 million metric tons of corn lost to tar spot in 2018, around $680 million</li><li id="src-27"><a href="https://cropprotectionnetwork.org/news/smartphone-application-to-forecast-white-mold-in-soybean-now-available-to-growers" rel="noopener">Crop Protection Network: Sporecaster app for white mold in soybean, March 19, 2019</a>; Weather-based prediction with 81.8% accuracy; spray at flowering</li><li id="src-28"><a href="https://ams.confex.com/ams/pdfpapers/103912.pdf" rel="noopener">NC State Climate Office: Weather and Climate Decision Support Tools for Agricultural Applications (AMS paper)</a>; Peanut leaf spot advisories saved 1–2 sprays in 2005, up to $2.2 million; 300+ weather stations</li><li id="src-29"><a href="https://ipm.missouri.edu/MEG/2018/3/rainfastness_pesticides/" rel="noopener">University of Missouri IPM: Rainfastness of pesticides, March 28, 2018</a>; Two inches of rain within 24 hours generally requires reapplication</li><li id="src-30"><a href="https://www.mda.state.mn.us/sites/default/files/docs/2026-04/herbdriftmgmt_0.pdf" rel="noopener">Minnesota Department of Agriculture: Herbicide Drift Management card (2020)</a>; Spray only at 3–10 mph wind; signs of a temperature inversion</li><li id="src-31"><a href="https://www.cira.colostate.edu/science-stories/by-the-numbers-forecast-benefits-to-agriculture/" rel="noopener">CIRA, Colorado State University: By the numbers, forecast benefits to agriculture, March 2025</a>; Raisin, lettuce and wine-grape forecast values</li><li id="src-32"><a href="https://www.fb.org/market-intel/hurricanes-heat-and-hardship-counting-2024s-crop-losses" rel="noopener">American Farm Bureau Federation: Counting 2024&#x27;s crop losses, February 18, 2025</a>; Over $20.3 billion in 2024 crop and rangeland losses from weather and fire</li><li id="src-33"><a href="https://deepmind.google/discover/blog/machine-learning-can-boost-the-value-of-wind-energy/" rel="noopener">DeepMind: Machine learning can boost the value of wind energy, February 26, 2019</a>; 36-hour wind output forecasts raised wind energy value about 20% on 700 MW</li><li id="src-34"><a href="https://www.wartsila.com/energy/learn-more/technology-comparison-engines-vs-aeros/derating-due-to-ambient-temperature" rel="noopener">Wärtsilä: Derating due to ambient temperature</a>; Gas turbines lose 5–10% of output per 10 °C above 15 °C (a maker of competing engines)</li><li id="src-35"><a href="https://www.faa.gov/nextgen/programs/weather/faq" rel="noopener">FAA: Weather delay FAQ</a>; Weather caused 74.26% of system-impacting delays, June 2017 to May 2023</li><li id="src-36"><a href="https://www.ercot.com/static-assets/data/news/content/a-peak-demand/all-time-records.htm" rel="noopener">ERCOT: Yearly peak demand records</a>; Record 91,089 MW on July 22, 2026, unofficial until settlement</li><li id="src-37"><a href="https://www.nerc.com/pa/rrm/ea/Documents/February_2021_Cold_Weather_Report.pdf" rel="noopener">FERC, NERC and Regional Entity staff: The February 2021 Cold Weather Outages in Texas and the South Central United States, November 2021</a>; 23,418 MW of firm load shed; over 4.5 million Texans lost power</li><li id="src-38"><a href="https://www.energystar.gov/products/data_center_equipment/16-more-ways-cut-energy-waste-data-center/use-air-side-economizer" rel="noopener">ENERGY STAR: Use an air-side economizer</a>; Free-cooling hours depend on local climate</li><li id="src-39"><a href="https://deepmind.google/discover/blog/deepmind-ai-reduces-google-data-centre-cooling-bill-by-40/" rel="noopener">DeepMind: DeepMind AI reduces Google data centre cooling bill by 40%, July 20, 2016</a>; Cooling energy cut by up to 40%; 15% lower PUE overhead</li><li id="src-40"><a href="https://blog.google/inside-google/infrastructure/data-centers-work-harder-sun-shines-wind-blows/" rel="noopener">Google: Our data centers now work harder when the sun shines and wind blows, April 22, 2020</a>; Day-ahead forecasts used to shift flexible compute</li><li id="src-41"><a href="https://greenvoyage2050.imo.org/technology/weather-routing/" rel="noopener">IMO GreenVoyage2050: Weather routing</a>; Fuel saving potential of 0.5–5%</li><li id="src-42"><a href="https://alertcalifornia.org/about/" rel="noopener">ALERTCalifornia, UC San Diego: About</a>; AI cameras detected over 1,200 fires, beating 911 calls over 30% of the time</li><li id="src-43"><a href="https://ideas.repec.org/a/gam/jsusta/v13y2021i5p2861-d511926.html" rel="noopener">Schuldt et al.: Weather-Related Construction Delays in a Changing Climate, Sustainability, 2021</a>; Adverse weather delays 45% of construction projects worldwide</li><li id="src-44"><a href="https://www.cdc.gov/media/releases/2024/p0422-heat-protection.html" rel="noopener">CDC: Heat and health tools, April 22, 2024</a>; HeatRisk seven-day heat forecast from CDC and NOAA</li>
</ol>
</details>

## Frequently asked questions

### What is AI weather forecasting?

AI weather forecasting uses machine learning models trained on decades of past weather data to predict future weather. For example, GraphCast learned from 39 years of reanalysis data and produces a 10-day global forecast in under one minute.

### Is AI weather forecasting more accurate than traditional forecasting?

On ordinary days, leading AI models match or beat traditional models on most measures. For instance, GraphCast beat the leading traditional forecast on 90% of 1,380 test measures. However, a 2026 study found physics-based models did better on record-breaking heat, cold and wind.

### Do weather services use AI models today?

Yes. ECMWF made its AI model operational on February 25, 2025, while NOAA deployed three AI-driven global models in December 2025. In addition, the National Hurricane Center used AI models in real-time operations for the first time in 2025.

### Why are AI weather models so fast?

The heavy work happens once, during training, so each later forecast is cheap to run. In fact, NOAA says one 16-day AI forecast uses only 0.3% of the computing of its standard global model.

### What is an ensemble forecast?

An ensemble runs a forecast many times with small changes to show the range of possible outcomes. For example, NOAA's hybrid system combines 31 physics runs and 31 AI runs into a 62-member ensemble.

### Did AI help forecast Hurricane Melissa?

AI guidance was part of the picture. Forecasters cited Google DeepMind ensembles when discussing Melissa's rapid strengthening. Meanwhile, the National Hurricane Center gave almost three days of notice that Melissa would hit Jamaica as a Category 5.

### How do weather forecasts help farmers time fungicide sprays?

Disease risk models use humidity, temperature and rain to estimate infection risk, while spray-day forecasts check rain, wind and inversions. For wheat scab, fungicide works best at early flowering and cuts symptoms and toxins by about 40% to 60%.

### How do utilities use weather forecasts before storms?

Utilities use outage prediction models to stage crews before a storm. For example, the UConn model used by Eversource gives a picture of likely damage up to three days ahead, updated every six hours.

### How does weather affect data centers?

Weather drives power and cooling. According to Wärtsilä, gas turbines lose 5% to 10% of output for every 10°C above 15°C. By contrast, cool weather allows free cooling with outside air, so forecasts help operators plan both.

### Should I rely on an AI weather app for emergencies?

No. For life-safety decisions, follow official National Weather Service warnings and local emergency officials. AI forecasts are useful guidance; however, the official warning process remains the authority.