# Athlete Performance Data: What the Science Is Missing

> The rules coaches train by rest on small, mostly male studies. We read the record before starting a project of our own.

Source: https://savrn.com/blog/athlete-performance-data
Author: Chad Everett Harris
Published: 2026-09-28

---

Athlete performance data looks abundant, because professional teams put sensors on their players and a phone can film a jump. However, the rules that coaches train by rest on far less than that. For example, one widely used workload rule began with 28 cricket bowlers <sup class="cite"><a href="https://bjsm.bmj.com/lookup/doi/10.1136/bjsports-2013-092524" rel="noopener" title="Hulin BT 2014, British Journal of Sports Medicine 48(8):708-712">1</a></sup>. Likewise, a well-known injury forecasting model was trained on 26 soccer players from one club <sup class="cite"><a href="https://dx.plos.org/10.1371/journal.pone.0201264" rel="noopener" title="Rossi A 2018, PLoS ONE 13(7):e0201264">2</a></sup>. In addition, a review of 204 injury prediction models found that none had been tested on a second group of athletes <sup class="cite"><a href="https://link.springer.com/10.1007/s40279-022-01698-9" rel="noopener" title="Bullock GS 2022, Sports Medicine 52(10):2469-2482">3</a></sup>. SAVRN is looking at a project in athletic performance, so I wanted to read the record first. This post is that homework.

## Why this matters now

The number of athletes is large and growing. For example, high school sports in the United States counted 8,266,244 participants in 2024-25, which was a record <sup class="cite"><a href="https://www.nfhs.org/articles/participation-in-high-school-sports-hits-record-high-with-sizable-increase-in-2024-25/" rel="noopener" title="National Federation of State High School Associations 2025, NFHS">4</a></sup>. College sports set a record too, since the NCAA counted 554,298 athletes in its championship sports that year <sup class="cite"><a href="https://www.ncaa.org/media-center-a-record-number-of-ncaa-student-athletes-participated-in-2024-25/" rel="noopener" title="National Collegiate Athletic Association 2025, NCAA.org">5</a></sup>. Meanwhile, a federal survey put medically attended sports and recreation injuries at 8.6 million a year in 2011 to 2014. People aged 5 to 24 accounted for 64.9% of them <sup class="cite"><a href="https://pubmed.ncbi.nlm.nih.gov/27906643/" rel="noopener" title="Sheu Y 2016, National Health Statistics Reports 99">6</a></sup>.

At the professional level, injuries cost money and games. For example, an insurance broker counted 4,456 injuries in Europe's top five men's soccer leagues in 2024/25, with €676.14 million paid in wages to injured players <sup class="cite"><a href="https://www.howdengroup.com/de-en/202425-mens-european-football-injury-index" rel="noopener" title="Howden 2025, Howden">7</a></sup>. In addition, a study of the English Premier League estimated that injuries cost a team about £45 million a season in lost performance <sup class="cite"><a href="https://bmjopensem.bmj.com/lookup/doi/10.1136/bmjsem-2019-000675" rel="noopener" title="Eliakim E 2020, BMJ Open Sport and Exercise Medicine 6(1)">8</a></sup>. Across 24 European clubs and 11 seasons, a club tended to finish higher in its league in seasons when its injury burden was lower <sup class="cite"><a href="https://bjsm.bmj.com/lookup/doi/10.1136/bjsports-2013-092215" rel="noopener" title="Hagglund M 2013, British Journal of Sports Medicine 47(12):738-742">9</a></sup>.

So the need is clear, and the sensors are already on the field. What is thin is the evidence in between, because most published studies are small and most of the athletes in them are men. In addition, teams often treat their data as a competitive advantage, so few findings are ever checked on a second group <sup class="cite"><a href="https://link.springer.com/10.1007/s40279-023-01849-6" rel="noopener" title="Bullock GS 2023, Sports Medicine 53(10):1841-1849">10</a></sup>. As a result, a coach can have a screen full of numbers and still have no tested rule for using them.

<div class="statband">
  <div class="stat"><div class="n">0 of 204</div><div class="l">injury prediction models had been tested on a second group of athletes</div><div class="src">Sports Medicine, 2022</div></div>
  <div class="stat"><div class="n">34%</div><div class="l">of participants were women, across 5,261 publications in six sport science journals</div><div class="src">Women in Sport and Physical Activity Journal, 2021</div></div>
  <div class="stat"><div class="n">About 200</div><div class="l">injured athletes are needed to detect a small to moderate risk factor</div><div class="src">British Journal of Sports Medicine, 2003</div></div>
</div>

<div class="kbox">
  <h3 class="lvl4">What to take from this</h3>
  <ul>
    <li>Well-known training rules began with small groups, specifically 28 cricket bowlers, 26 soccer players and 112 students at one school.</li>
    <li>A review of 204 injury prediction models found none tested on outside athletes, while the largest ACL cohort in a team ball sport scored 0.63 on a scale where 0.5 is a coin flip.</li>
    <li>In six sport science journals, women were 34% of participants, and team sport AI studies were 97% male. Only 3.8% of 842 sports medicine studies reported race.</li>
    <li>Large, consistent records have produced usable findings. For example, UEFA&#x27;s 18-season study of elite men&#x27;s clubs recorded injury rates falling 3% a season.</li>
    <li>Data does not fix everything, because a proven hamstring program halves hamstring injuries and 83.3% of elite men&#x27;s club seasons did not follow it.</li>
  </ul>
</div>

## What does the record show in numbers?

Table 1 holds the figures this post relies on. I read each one in the paper or report that published it, and the sources are listed at the end.

<div class="btab">
<p class="btab-cap"><b>Table 1</b> Key figures on athlete data, with the period and source for each</p>
<div class="brows">
<div class="br"><div class="br-k">High school sports participants, United States</div><div class="br-v">8,266,244</div><div class="br-b">2024-25 school year, a record <sup class="cite"><a href="https://www.nfhs.org/articles/participation-in-high-school-sports-hits-record-high-with-sizable-increase-in-2024-25/" rel="noopener" title="National Federation of State High School Associations 2025, NFHS">4</a></sup></div></div>
<div class="br"><div class="br-k">NCAA athletes in championship sports</div><div class="br-v">554,298</div><div class="br-b">2024-25, an all-time high <sup class="cite"><a href="https://www.ncaa.org/media-center-a-record-number-of-ncaa-student-athletes-participated-in-2024-25/" rel="noopener" title="National Collegiate Athletic Association 2025, NCAA.org">5</a></sup></div></div>
<div class="br"><div class="br-k">Sports and recreation injury episodes a year, United States</div><div class="br-v">8.6 million</div><div class="br-b">2011 to 2014; ages 5 to 24 were 64.9% <sup class="cite"><a href="https://pubmed.ncbi.nlm.nih.gov/27906643/" rel="noopener" title="Sheu Y 2016, National Health Statistics Reports 99">6</a></sup></div></div>
<div class="br"><div class="br-k">Injuries in Europe&#x27;s top five men&#x27;s soccer leagues</div><div class="br-v">4,456</div><div class="br-b">2024/25 season, at a cost of €676.14 million <sup class="cite"><a href="https://www.howdengroup.com/de-en/202425-mens-european-football-injury-index" rel="noopener" title="Howden 2025, Howden">7</a></sup></div></div>
<div class="br"><div class="br-k">Athletes in the first workload ratio study</div><div class="br-v">28</div><div class="br-b">Elite cricket fast bowlers, published 2014 <sup class="cite"><a href="https://bjsm.bmj.com/lookup/doi/10.1136/bjsports-2013-092524" rel="noopener" title="Hulin BT 2014, British Journal of Sports Medicine 48(8):708-712">1</a></sup></div></div>
<div class="br"><div class="br-k">Injury prediction models tested on outside athletes</div><div class="br-v">0 of 204</div><div class="br-b">30 studies, searched to June 2021 <sup class="cite"><a href="https://link.springer.com/10.1007/s40279-022-01698-9" rel="noopener" title="Bullock GS 2022, Sports Medicine 52(10):2469-2482">3</a></sup></div></div>
<div class="br"><div class="br-k">Best score in the largest team ball sport ACL cohort</div><div class="br-v">0.63</div><div class="br-b">791 elite female players and 60 injuries; a coin flip scores 0.5 <sup class="cite"><a href="https://journals.sagepub.com/doi/10.1177/03635465221112095" rel="noopener" title="Jauhiainen S 2022, American Journal of Sports Medicine 50(11):2917-2924">33</a></sup></div></div>
<div class="br"><div class="br-k">Median sample size in the Journal of Sports Sciences</div><div class="br-v">19</div><div class="br-b">Reported in a 2022 review <sup class="cite"><a href="https://royalsocietypublishing.org/doi/10.1098/rsos.220946" rel="noopener" title="Mesquida C 2022, Royal Society Open Science 9(12):220946">21</a></sup></div></div>
<div class="br"><div class="br-k">Published studies that held up when repeated</div><div class="br-v">7 of 25</div><div class="br-b">28%, studies published 2016 to 2021 <sup class="cite"><a href="https://link.springer.com/10.1007/s40279-025-02201-w" rel="noopener" title="Murphy J 2025, Sports Medicine 55(10):2659-2679">22</a></sup></div></div>
<div class="br"><div class="br-k">Injured athletes needed to detect a small to moderate risk factor</div><div class="br-v">About 200</div><div class="br-b">Methods paper, 2003 <sup class="cite"><a href="https://bjsm.bmj.com/lookup/doi/10.1136/bjsm.37.5.384" rel="noopener" title="Bahr R 2003, British Journal of Sports Medicine 37(5):384-392">23</a></sup></div></div>
<div class="br"><div class="br-k">Women as a share of research participants</div><div class="br-v">34%</div><div class="br-b">5,261 publications in six journals, 2014 to 2020; 6% studied women only <sup class="cite"><a href="https://journals.humankinetics.com/view/journals/wspaj/29/2/article-p146.xml" rel="noopener" title="Cowley ES 2021, Women in Sport and Physical Activity Journal 29(2):146-151">37</a></sup></div></div>
<div class="br"><div class="br-k">Men as a share of participants in team sport AI studies</div><div class="br-v">97%</div><div class="br-b">58 studies and 6,456 participants <sup class="cite"><a href="https://sportsmedicine-open.springeropen.com/articles/10.1186/s40798-019-0202-3" rel="noopener" title="Claudino JG 2019, Sports Medicine - Open 5(1):28">38</a></sup></div></div>
<div class="br"><div class="br-k">Sports medicine studies that reported athlete race</div><div class="br-v">3.8%</div><div class="br-b">842 studies in three journals, 2017 to 2021 <sup class="cite"><a href="https://journals.sagepub.com/doi/10.1177/23259671241261679" rel="noopener" title="Sonnier JH 2024, Orthopaedic Journal of Sports Medicine 12(10):23259671241261679">43</a></sup></div></div>
</div>
</div>

## How small are the studies behind common training rules?

Start with the best-known rule in load management. It compares this week's workload with the average of recent weeks. In 2016, a review proposed that a ratio of 0.8 to 1.3 was a training "sweet spot," while 1.5 or more was a "danger zone" <sup class="cite"><a href="https://bjsm.bmj.com/lookup/doi/10.1136/bjsports-2015-095788" rel="noopener" title="Gabbett TJ 2016, British Journal of Sports Medicine 50(5):273-280">11</a></sup>. The International Olympic Committee then repeated that range in a consensus statement the same year <sup class="cite"><a href="https://bjsm.bmj.com/lookup/doi/10.1136/bjsports-2016-096581" rel="noopener" title="Soligard T 2016, British Journal of Sports Medicine 50(17):1030-1041 (International Olympic Committee)">12</a></sup>. However, the first studies behind the ratio followed 28 cricket bowlers and 53 rugby league players <sup class="cite"><a href="https://bjsm.bmj.com/lookup/doi/10.1136/bjsports-2013-092524" rel="noopener" title="Hulin BT 2014, British Journal of Sports Medicine 48(8):708-712">1</a>, <a href="https://bjsm.bmj.com/lookup/doi/10.1136/bjsports-2015-094817" rel="noopener" title="Hulin BT 2016, British Journal of Sports Medicine 50(4):231-236">13</a></sup>. A later review found 20 studies of the ratio in professional team sport, although every one of the 1,234 athletes was male <sup class="cite"><a href="https://link.springer.com/10.1007/s40279-020-01308-6" rel="noopener" title="Andrade R 2020, Sports Medicine 50(9):1613-1635">14</a></sup>.

Then the rule was tested. First, a randomized trial divided 34 elite youth soccer teams, both girls and boys, into two groups. Eighteen teams were assigned to manage load by the ratio for 10 months. Nine teams soon withdrew, which left 482 players in the trial. It found no reduction in health problems, since the relative risk was 1.01 <sup class="cite"><a href="https://bjsm.bmj.com/lookup/doi/10.1136/bjsports-2020-103003" rel="noopener" title="Dalen-Lorentsen T 2021, British Journal of Sports Medicine 55(2):108-114">15</a></sup>. Second, a re-analysis divided each player's weekly load by one fixed number, the group average, instead of that player's own recent average. The injury odds came out similar, at 1.95 against 2.45 <sup class="cite"><a href="https://link.springer.com/10.1007/s40279-020-01378-6" rel="noopener" title="Impellizzeri FM 2021, Sports Medicine 51(3):581-592">16</a></sup>. Third, a study followed 2,633 adolescent ice hockey players. Injury risk rose steadily as planned hockey time rose relative to the prior four weeks, so there was no sweet spot <sup class="cite"><a href="https://linkinghub.elsevier.com/retrieve/pii/S1440244024005243" rel="noopener" title="Wang C 2025, Journal of Science and Medicine in Sport 28(2):132-139">17</a></sup>.

Other familiar advice has the same shape. For example, one finding holds that adolescent athletes who slept under 8 hours were 1.7 times more likely to have had an injury. It came from 112 athletes at one school <sup class="cite"><a href="https://pubmed.ncbi.nlm.nih.gov/25028798/" rel="noopener" title="Milewski MD 2014, Journal of Pediatric Orthopaedics 34(2):129-133">18</a></sup>. For adult athletes, by contrast, a review of 12 prospective studies did not support poor sleep as an independent injury risk <sup class="cite"><a href="https://link.springer.com/10.1007/s40279-020-01416-3" rel="noopener" title="Dobrosielski DA 2021, Sports Medicine 51(4):777-793">19</a></sup>. Likewise, training guided by heart rate variability is a common wearable feature, while the pooled trials behind it cover 198 people <sup class="cite"><a href="https://linkinghub.elsevier.com/retrieve/pii/S1440244021001080" rel="noopener" title="Duking P 2021, Journal of Science and Medicine in Sport 24(11):1180-1192">20</a></sup>.

The field has measured this pattern in itself. For instance, one review reported a median sample size of 19 in the Journal of Sports Sciences. It also reported that only 12 of 120 studies had worked out in advance how many people they needed <sup class="cite"><a href="https://royalsocietypublishing.org/doi/10.1098/rsos.220946" rel="noopener" title="Mesquida C 2022, Royal Society Open Science 9(12):220946">21</a></sup>. When researchers repeated 25 published studies from top journals, 7 held up, which is 28% <sup class="cite"><a href="https://link.springer.com/10.1007/s40279-025-02201-w" rel="noopener" title="Murphy J 2025, Sports Medicine 55(10):2659-2679">22</a></sup>.

## How many injuries does a study need?

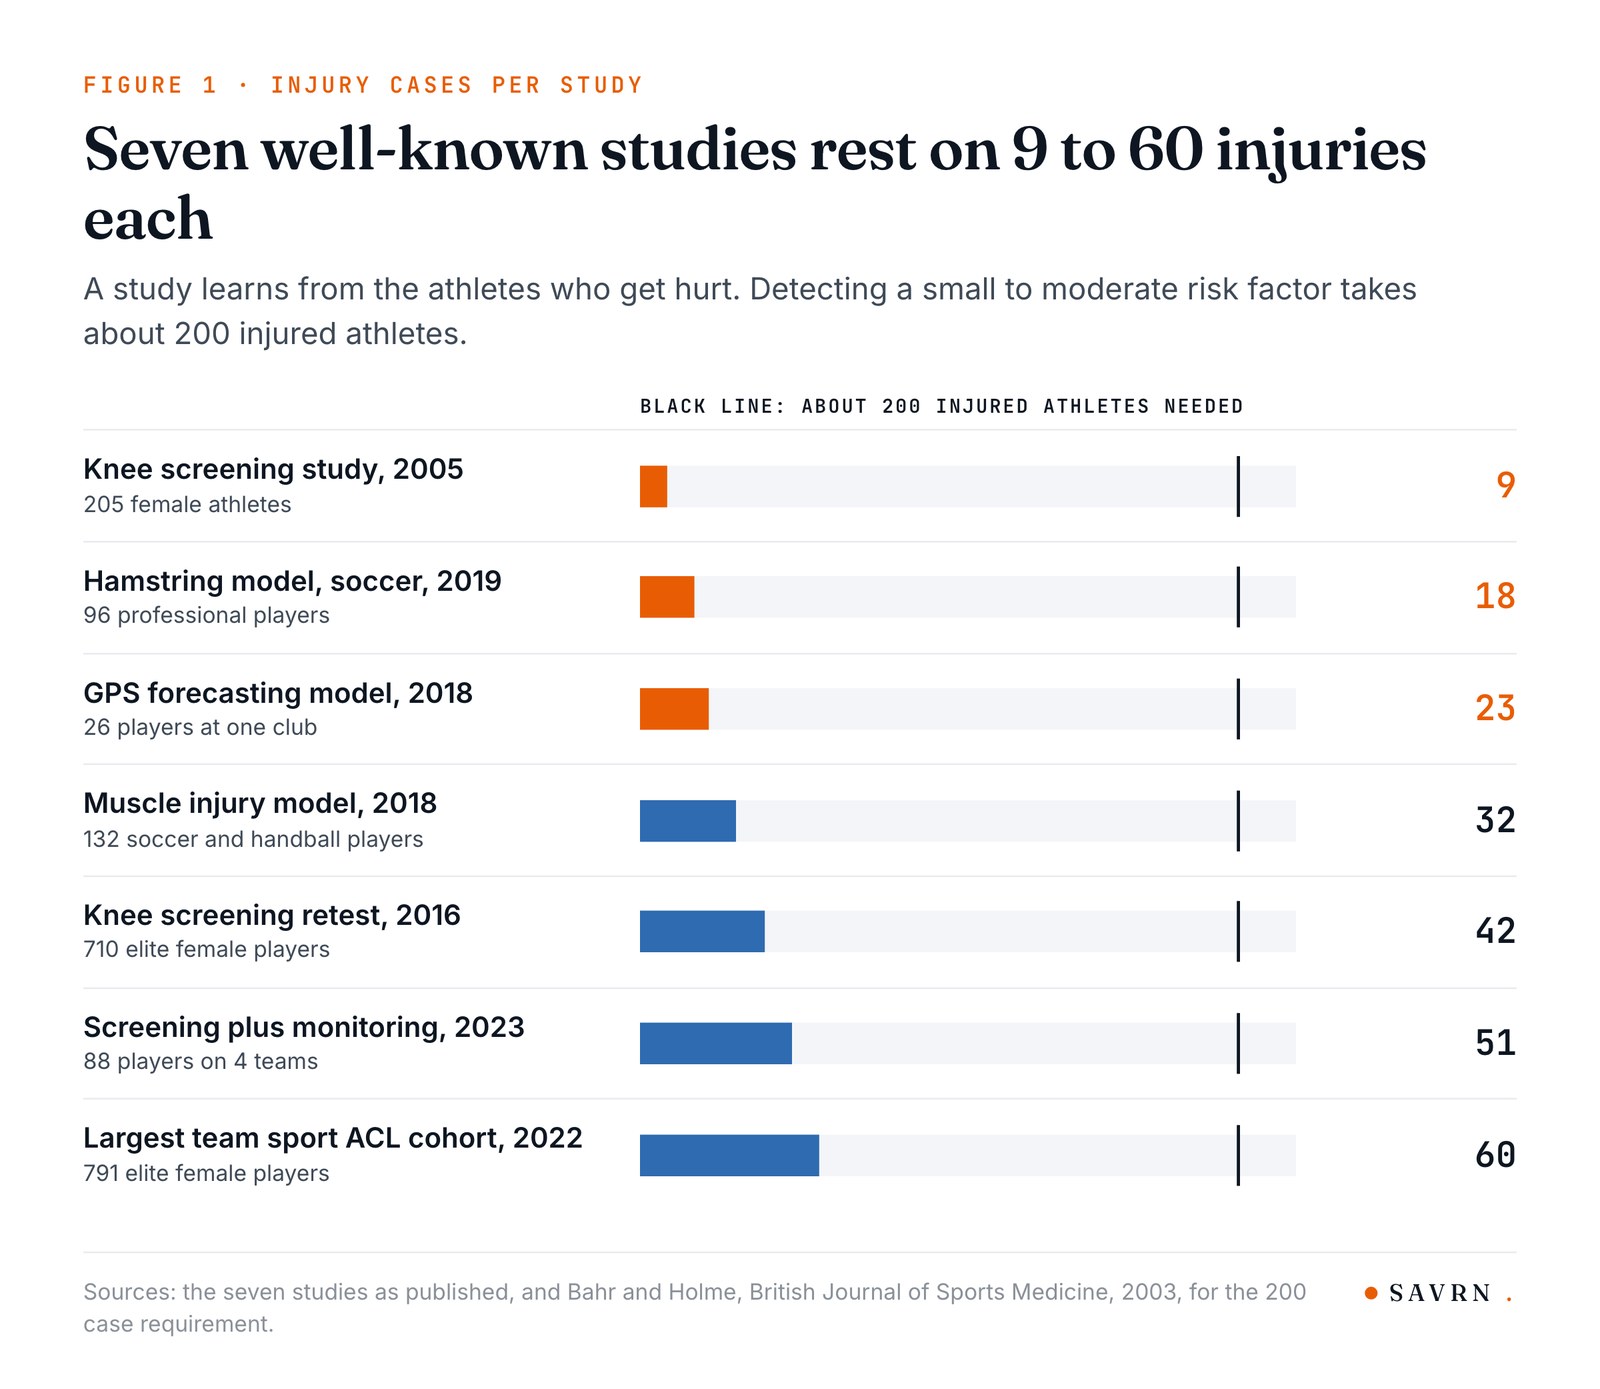
The count that matters is injuries, because a study learns from the athletes who get hurt. In 2003, two researchers worked out the requirement. Specifically, a study needs 20 to 50 injury cases to detect a moderate to strong risk factor. However, it needs about 200 injured athletes to detect a small to moderate one <sup class="cite"><a href="https://bjsm.bmj.com/lookup/doi/10.1136/bjsm.37.5.384" rel="noopener" title="Bahr R 2003, British Journal of Sports Medicine 37(5):384-392">23</a></sup>.

Very few studies reach that bar. For example, the landmark knee screening study followed 205 female athletes and recorded 9 torn anterior cruciate ligaments, or ACLs. It reported that one landing measure predicted injury with 78% sensitivity and 73% specificity <sup class="cite"><a href="https://journals.sagepub.com/doi/10.1177/0363546504269591" rel="noopener" title="Hewett TE 2005, American Journal of Sports Medicine 33(4):492-501">24</a></sup>. Eleven years later, a study of 710 elite female players recorded 42 new noncontact ACL injuries. However, none of its five landing measures predicted injury in players who had not been hurt before <sup class="cite"><a href="https://journals.sagepub.com/doi/10.1177/0363546515625048" rel="noopener" title="Krosshaug T 2016, American Journal of Sports Medicine 44(4):874-883">25</a></sup>. Figure 1 sets seven well-known studies against the bar, including three team sport models that recorded 18, 32 and 51 injuries <sup class="cite"><a href="https://www.thieme-connect.de/DOI/DOI?10.1055/a-0826-1955" rel="noopener" title="Ayala F 2019, International Journal of Sports Medicine 40(5):344-353">26</a>, <a href="https://pubmed.ncbi.nlm.nih.gov/29283933/" rel="noopener" title="López-Valenciano A 2018, Medicine and Science in Sports and Exercise 50(5):915-927">27</a>, <a href="https://www.tandfonline.com/doi/full/10.1080/24733938.2022.2095006" rel="noopener" title="Hecksteden A 2023, Science and Medicine in Football 7(3):214-228">28</a></sup>.

<figure class="bfig"><img src="/media/blog-athlete-performance-data-fig1-cases-20260928.jpg" alt="Bar chart of injury cases behind seven well-known studies, from 9 to 60, against a line at 200 cases" loading="lazy"><figcaption>Figure 1. Injury cases behind seven well-known studies, against the 200 needed to detect a small to moderate risk factor.</figcaption></figure>

The arithmetic shows why one team cannot settle the question alone. Across 58 studies, female athletes tore an ACL at a rate of 1.5 per 10,000 athlete exposures, where an exposure is one practice or game <sup class="cite"><a href="https://bjsm.bmj.com/lookup/doi/10.1136/bjsports-2016-096274" rel="noopener" title="Montalvo AM 2019, British Journal of Sports Medicine 53(16):1003-1012">29</a></sup>. Therefore a study needs about 1.33 million exposures to record 200 injuries at that rate. Suppose a squad of 25 logs 150 practices and games each per season, which is 3,750 exposures. That squad would need about 356 seasons. As a result, the only route to the number is many teams keeping the same record in the same way.

## How well do injury prediction models work?

In a 2026 review of 97 sports medicine AI studies, prediction and estimation models made up 57.7% of applications, so this part of the record matters <sup class="cite"><a href="https://link.springer.com/10.1186/s12911-026-03615-w" rel="noopener" title="Lindskog J 2026, BMC Medical Informatics and Decision Making 26(1)">30</a></sup>. Models are usually scored on a scale where 0.5 is a coin flip, while 1.0 is perfect.

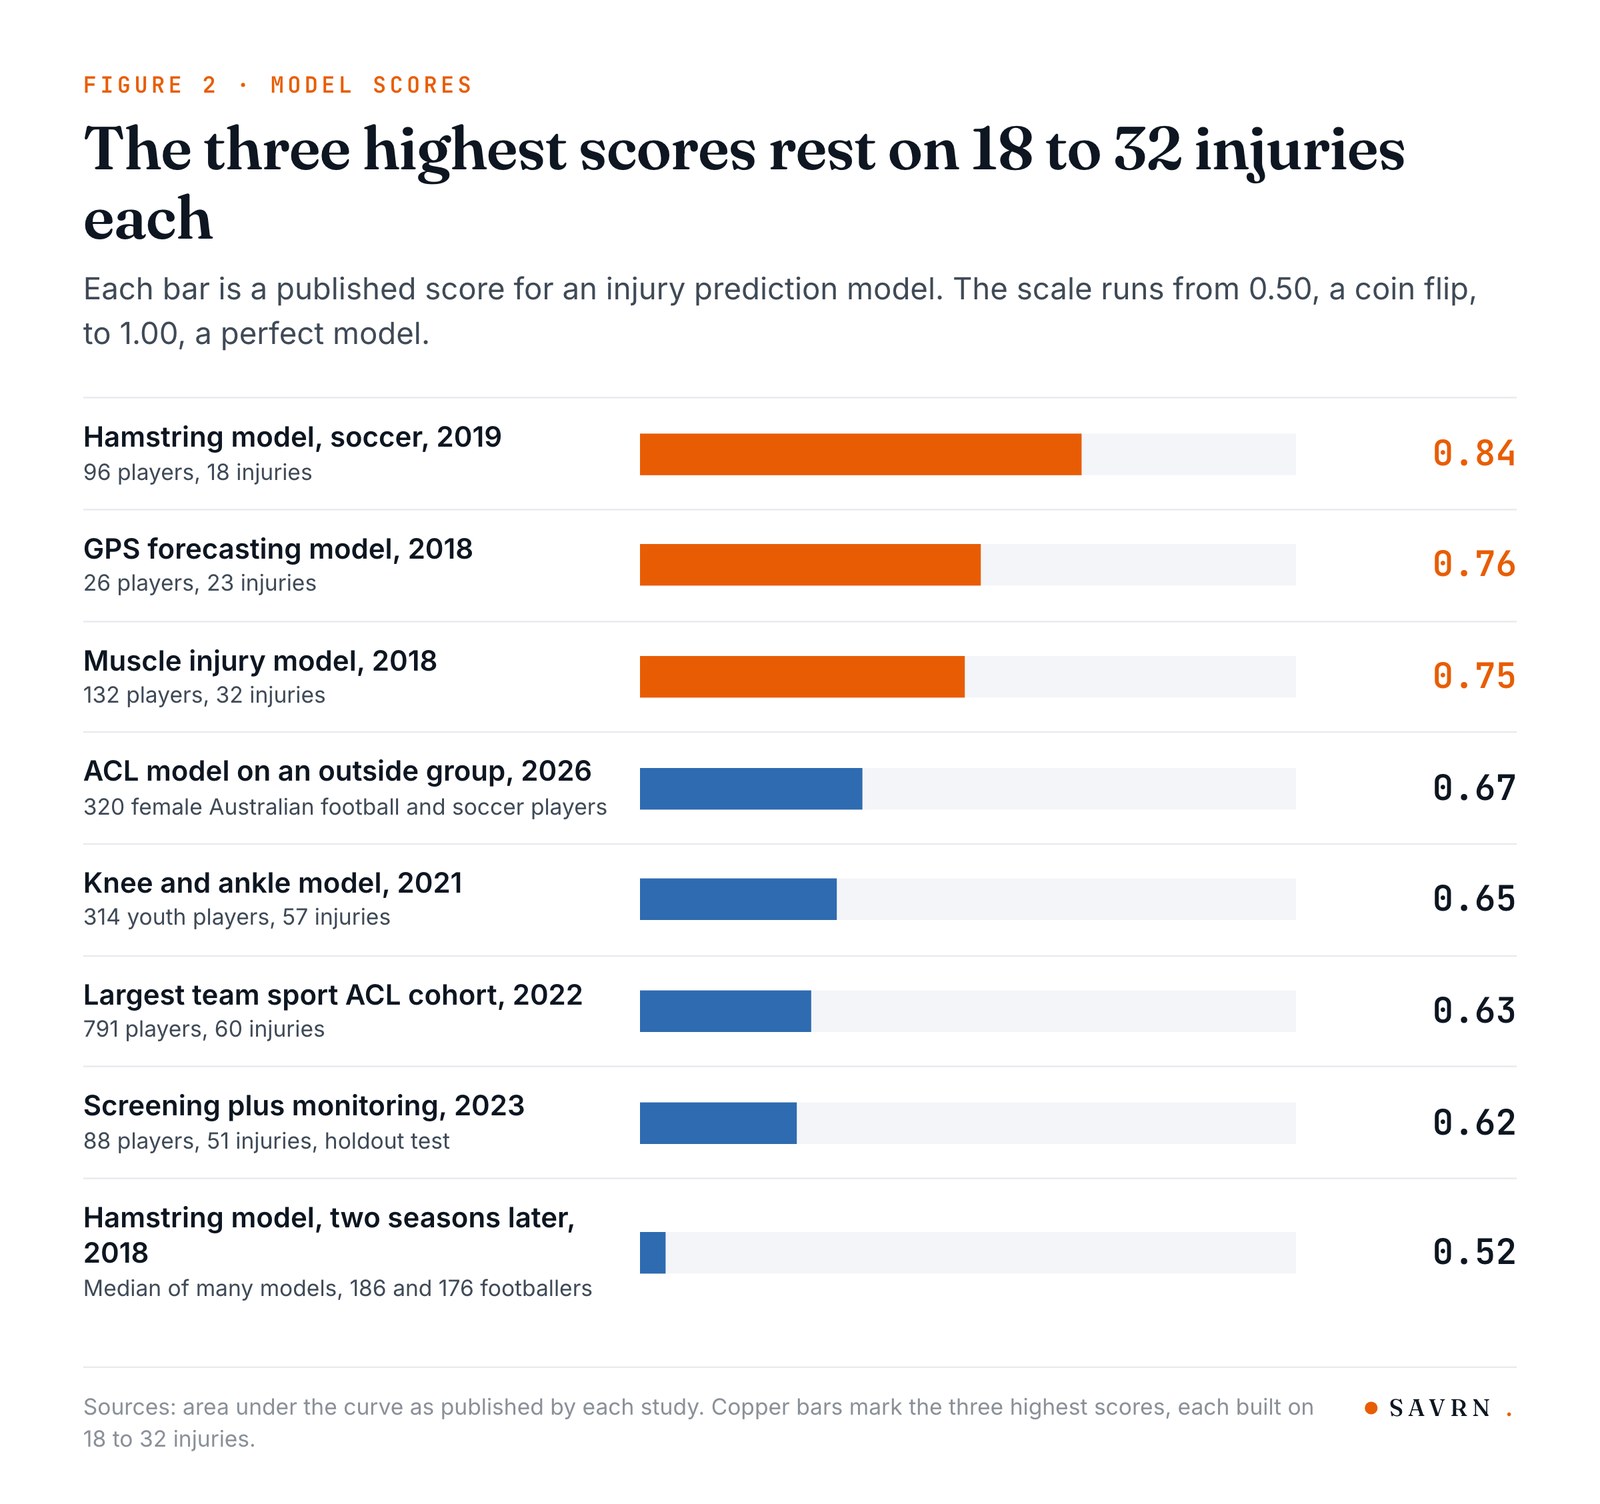
The best-known model used GPS data from 26 professional soccer players at one Italian club, who had 23 injuries. Its precision was 0.50, so half of its warnings were false alarms <sup class="cite"><a href="https://dx.plos.org/10.1371/journal.pone.0201264" rel="noopener" title="Rossi A 2018, PLoS ONE 13(7):e0201264">2</a></sup>. A review of machine learning injury models found 11 studies, with scores from 0.52 to 0.87 <sup class="cite"><a href="https://esskajournals.onlinelibrary.wiley.com/doi/10.1186/s40634-021-00346-x" rel="noopener" title="Van Eetvelde H 2021, Journal of Experimental Orthopaedics 8(1):27">31</a></sup>. However, a broader review of 30 studies and 204 models rated 98% of the models at high or unclear risk of bias. In addition, no study had tested its model on outside athletes <sup class="cite"><a href="https://link.springer.com/10.1007/s40279-022-01698-9" rel="noopener" title="Bullock GS 2022, Sports Medicine 52(10):2469-2482">3</a></sup>.

When models face a harder test, the scores fall. For example, hamstring models built on 2013 data from elite Australian footballers had a median score of 0.52 on 2015 data <sup class="cite"><a href="https://pubmed.ncbi.nlm.nih.gov/29266094/" rel="noopener" title="Ruddy JD 2018, Medicine and Science in Sports and Exercise 50(5):906-914">32</a></sup>. The largest ACL cohort in a team ball sport analyzed 283 variables for 791 elite female players, and 60 of them tore an ACL. Although the data was rich, its best model scored 0.63 <sup class="cite"><a href="https://journals.sagepub.com/doi/10.1177/03635465221112095" rel="noopener" title="Jauhiainen S 2022, American Journal of Sports Medicine 50(11):2917-2924">33</a></sup>. Similarly, a model for 314 youth basketball and floorball players scored 0.65 <sup class="cite"><a href="https://www.thieme-connect.de/DOI/DOI?10.1055/a-1231-5304" rel="noopener" title="Jauhiainen S 2021, International Journal of Sports Medicine 42(2):175-182">34</a></sup>. In 2026, researchers took an ACL model to an independent group of 320 female Australian football and soccer players. The score was 0.67, while the model overstated the risk <sup class="cite"><a href="https://journals.sagepub.com/doi/10.1177/19417381261457613" rel="noopener" title="Lopes Lima Y 2026, Sports Health">35</a></sup>.

<figure class="bfig"><img src="/media/blog-athlete-performance-data-fig2-scores-20260928.jpg" alt="Bar chart of eight injury prediction model scores from 0.52 to 0.84; the three highest rest on 18 to 32 injuries each" loading="lazy"><figcaption>Figure 2. Published scores for eight injury prediction models. The three highest each rest on 18 to 32 injuries.</figcaption></figure>

A more complex method has not been the answer. Across 125 head-to-head comparisons at low risk of bias in orthopedic sports medicine prediction models, machine learning showed no advantage over ordinary logistic regression <sup class="cite"><a href="https://linkinghub.elsevier.com/retrieve/pii/S2059775426000246" rel="noopener" title="Lu Y 2026, Journal of ISAKOS 17:101088">36</a></sup>. Meanwhile, a review of 97 sports medicine AI studies found only one that tested a prevention strategy built on a model <sup class="cite"><a href="https://link.springer.com/10.1186/s12911-026-03615-w" rel="noopener" title="Lindskog J 2026, BMC Medical Informatics and Decision Making 26(1)">30</a></sup>.

## Who is missing from the data?

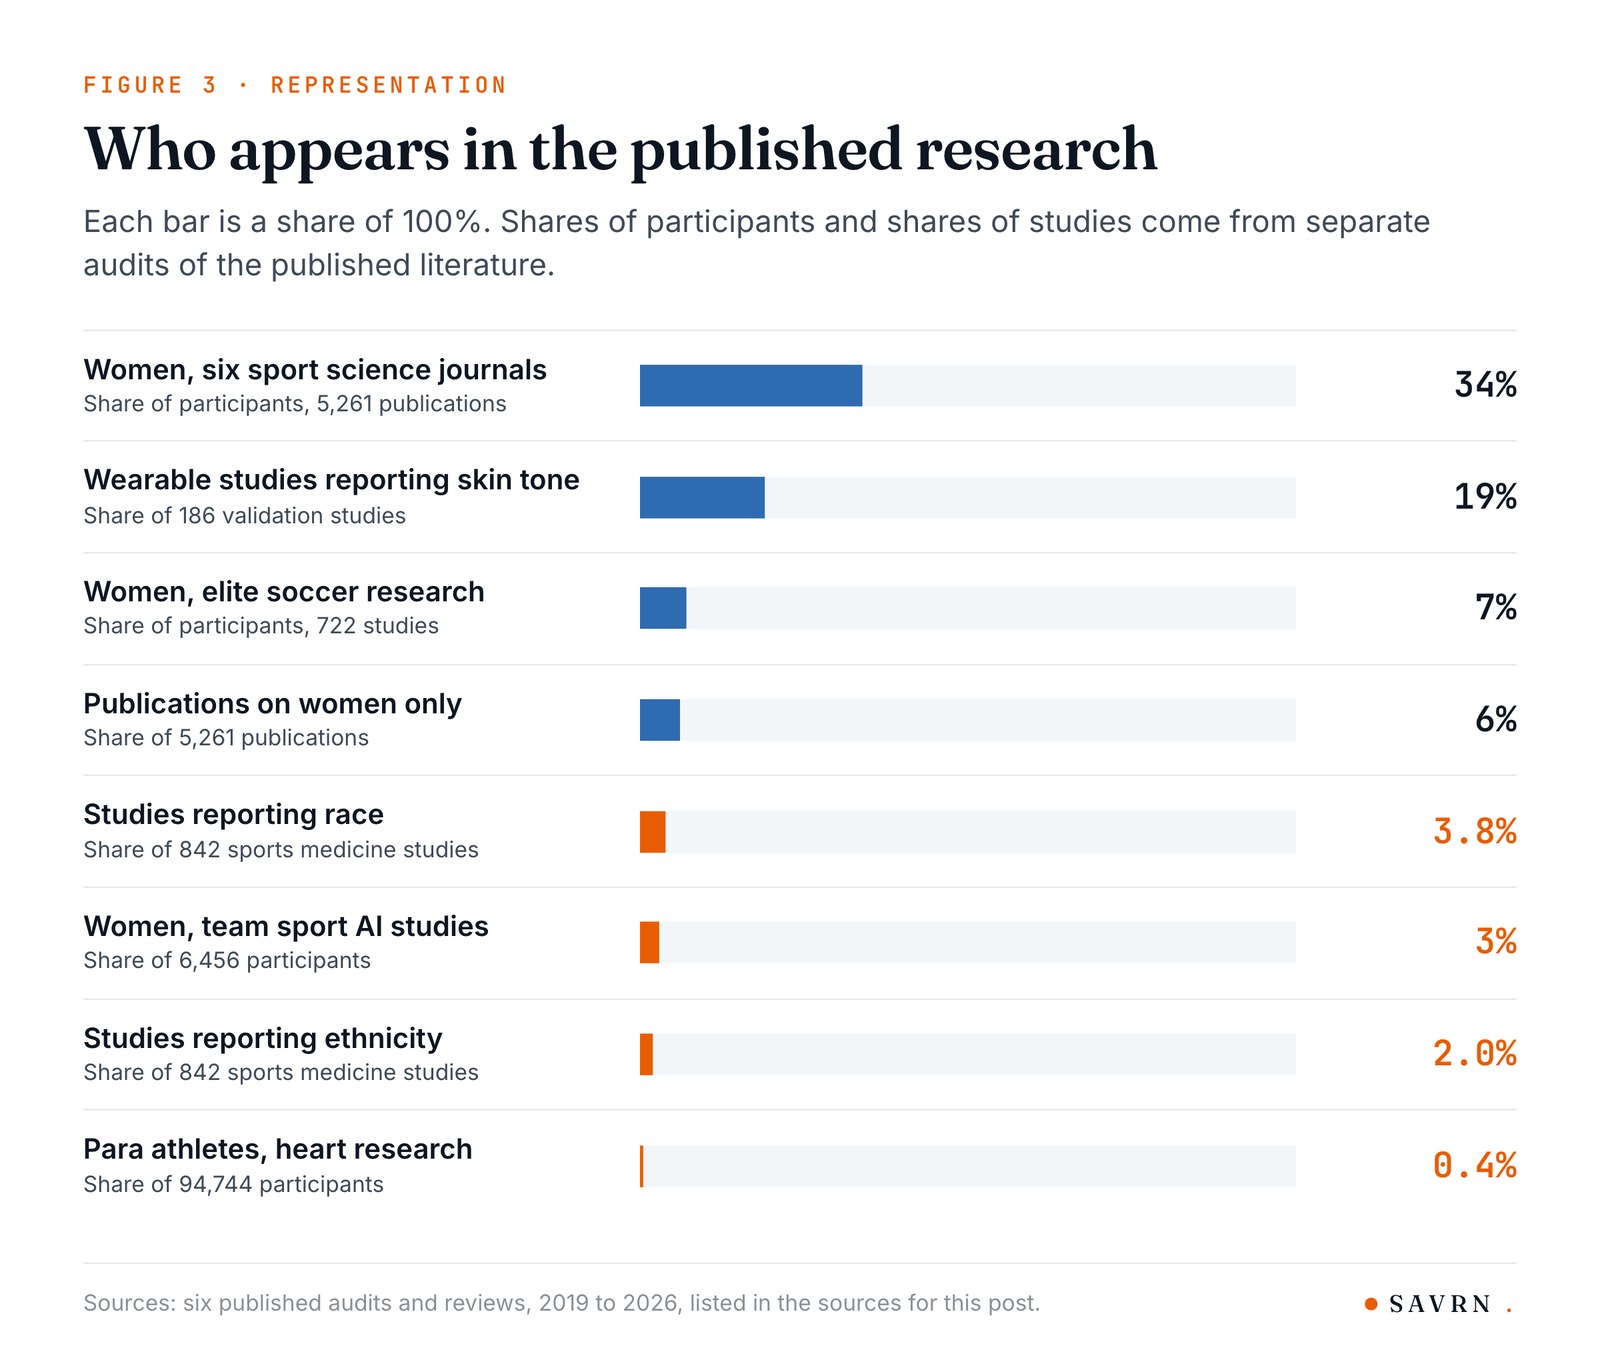
Women are the largest gap. An audit of 5,261 publications in six sport science journals found that 31% studied men only, while 6% studied women only. In addition, women were 34% of all participants <sup class="cite"><a href="https://journals.humankinetics.com/view/journals/wspaj/29/2/article-p146.xml" rel="noopener" title="Cowley ES 2021, Women in Sport and Physical Activity Journal 29(2):146-151">37</a></sup>. The gap is wider in AI research, since a review of 58 team sport studies found a pooled sample that was 97% male <sup class="cite"><a href="https://sportsmedicine-open.springeropen.com/articles/10.1186/s40798-019-0202-3" rel="noopener" title="Claudino JG 2019, Sports Medicine - Open 5(1):28">38</a></sup>. In elite soccer research, likewise, women were 7% of all participants <sup class="cite"><a href="https://www.tandfonline.com/doi/full/10.1080/24733938.2025.2577442" rel="noopener" title="Clausen E 2026, Science and Medicine in Football 10(3):358-373">39</a></sup>.

The gap matters because outcomes differ. For example, female athletes tear an ACL at 1.7 times the rate of male athletes across sports <sup class="cite"><a href="https://bjsm.bmj.com/lookup/doi/10.1136/bjsports-2016-096274" rel="noopener" title="Montalvo AM 2019, British Journal of Sports Medicine 53(16):1003-1012">29</a></sup>. Among adolescents the ratio is 1.40 overall, although it reaches 4.14 in basketball <sup class="cite"><a href="https://journals.sagepub.com/doi/10.1177/0363546520959619" rel="noopener" title="Bram JT 2021, American Journal of Sports Medicine 49(7):1962-1972">40</a></sup>. In high school sports played by both sexes, girls had 2.22 times the concussion rate of boys <sup class="cite"><a href="https://publications.aap.org/pediatrics/article/144/5/e20192180/38225/Concussion-Incidence-and-Trends-in-20-High-School" rel="noopener" title="Kerr ZY 2019, Pediatrics 144(5)">41</a></sup>. However, the research into why is thin. For instance, a 2026 analysis of muscle injury across the menstrual cycle found 3 eligible studies with 318 athletes, and it could make no recommendation <sup class="cite"><a href="https://www.nature.com/articles/s41598-026-36763-0" rel="noopener" title="Guthardt Y 2026, Scientific Reports 16(1):3035">42</a></sup>.

<figure class="bfig"><img src="/media/blog-athlete-performance-data-fig3-who-20260928.jpg" alt="Bar chart from six audits: women 34% of participants in six journals, race reported in 3.8% of 842 studies" loading="lazy"><figcaption>Figure 3. Who appears in sport science, sports medicine and wearable research, as a share of participants or of studies.</figcaption></figure>

Other groups are close to absent. For example, an audit of 842 sports medicine studies found that 3.8% reported race, while 2.0% reported ethnicity <sup class="cite"><a href="https://journals.sagepub.com/doi/10.1177/23259671241261679" rel="noopener" title="Sonnier JH 2024, Orthopaedic Journal of Sports Medicine 12(10):23259671241261679">43</a></sup>. Para athletes made up 0.4% of participants in 767 studies of the athlete's heart <sup class="cite"><a href="https://journals.physiology.org/doi/10.1152/ajpheart.00897.2025" rel="noopener" title="Henley-Martin SR 2026, American Journal of Physiology - Heart and Circulatory Physiology 330(4):H1302-H1318">44</a></sup>. However, injuries at the Paralympic Games run at 14.3 per 1,000 athlete days, against 6.5 at the Olympic Games <sup class="cite"><a href="https://bjsm.bmj.com/lookup/doi/10.1136/bjsports-2025-109980" rel="noopener" title="Torvaldsson K 2025, British Journal of Sports Medicine 59(18):1302-1314">45</a></sup>. In addition, only 19% of 186 validation studies for wearable optical sensors reported skin tone. The median share of participants with the darkest skin tones was 0% <sup class="cite"><a href="https://mhealth.jmir.org/2026/1/e87324" rel="noopener" title="Schipper RM 2026, JMIR mHealth and uHealth 14:e87324">46</a></sup>.

Young athletes are a special case, because a growing body changes the risk. In one academy study, non-contact and overuse injuries ran at 24.5 per 1,000 match hours around the growth spurt, against 11.5 before it <sup class="cite"><a href="https://onlinelibrary.wiley.com/doi/10.1080/17461391.2019.1633416" rel="noopener" title="Johnson DM 2020, European Journal of Sport Science 20(4):544-552">47</a></sup>. However, the three growth studies found for this post followed 26, 76 and 63 players. All of them were boys in soccer academies <sup class="cite"><a href="https://onlinelibrary.wiley.com/doi/10.1080/17461391.2019.1633416" rel="noopener" title="Johnson DM 2020, European Journal of Sport Science 20(4):544-552">47</a>, <a href="https://www.thieme-connect.de/DOI/DOI?10.1055/s-0033-1349874" rel="noopener" title="van der Sluis A 2014, International Journal of Sports Medicine 35(4):351-355">48</a>, <a href="https://linkinghub.elsevier.com/retrieve/pii/S1440244020307362" rel="noopener" title="Monasterio X 2021, Journal of Science and Medicine in Sport 24(3):218-223">49</a></sup>. In fact, one of those studies took 21 years of records at a single club to assemble <sup class="cite"><a href="https://linkinghub.elsevier.com/retrieve/pii/S1440244020307362" rel="noopener" title="Monasterio X 2021, Journal of Science and Medicine in Sport 24(3):218-223">49</a></sup>.

Small samples also produce numbers that travel too far. For example, one study of 36 players at a single club found that hamstring injury odds rose 1.78 times with each year of age <sup class="cite"><a href="https://linkinghub.elsevier.com/retrieve/pii/S1440244009001789" rel="noopener" title="Henderson G 2010, Journal of Science and Medicine in Sport 13(4):397-402">50</a></sup>. By contrast, a study of 1,401 professional players found no link between age and hamstring injury <sup class="cite"><a href="https://journals.sagepub.com/doi/10.1177/0363546512470634" rel="noopener" title="Hagglund M 2013, American Journal of Sports Medicine 41(2):327-335">51</a></sup>.

## Where has large-scale data already paid off?

Where someone has kept a large and consistent record, the results have been usable. For example, UEFA's injury study followed elite men's soccer clubs for 18 seasons, covering 3,302 players and 11,820 injuries. Over that period, injury rates fell 3% a season in both training and matches <sup class="cite"><a href="https://bjsm.bmj.com/lookup/doi/10.1136/bjsports-2020-103159" rel="noopener" title="Ekstrand J 2021, British Journal of Sports Medicine 55(19):1084-1091">52</a></sup>.

American school sports have a similar record. Specifically, one surveillance study has logged 134,167 injuries over 67,255,905 athlete exposures in 20 years of high school sports <sup class="cite"><a href="https://www.miaa.net/sites/default/files/2025-11/sports-medicine-2024-25-high-school-rio-brief-summary-report-august-2025-final.pdf" rel="noopener" title="Collins C 2025, National High School Sports-Related Injury Surveillance Study">53</a></sup>. That record is where the concussion comparison between girls and boys came from. Likewise, a concussion study run by the NCAA and the Department of Defense reports more than 53,000 enrolled athletes and cadets <sup class="cite"><a href="https://careconsortium.net/" rel="noopener" title="NCAA 2025, careconsortium.net">54</a></sup>. Its analysis of 1,071 concussions found no overall sex difference in median recovery, at 13.5 days for women against 11.8 for men. However, women took longer in contact sports and at Division II and III schools, while men took longer in limited-contact sports <sup class="cite"><a href="https://bjsm.bmj.com/lookup/doi/10.1136/bjsports-2020-103316" rel="noopener" title="Master CL 2021, British Journal of Sports Medicine 55(24):1387-1394">55</a></sup>.

Large records also change rules. In Ivy League football in 2015, kickoffs were 6% of plays, although they produced 21% of concussions. After a 2016 rule change, the concussion rate on kickoffs fell from 10.93 to 2.04 per 1,000 plays <sup class="cite"><a href="https://jama.jamanetwork.com/article.aspx?doi=10.1001/jama.2018.14165" rel="noopener" title="Wiebe DJ 2018, JAMA 320(19)">56</a></sup>. Similarly, the NFL says it simulated 10,000 seasons before it adopted a new kickoff format <sup class="cite"><a href="https://www.nfl.com/playerhealthandsafety/equipment-and-innovation/aws-partnership/advancing-player-health-and-safety-with-the-digital-athlete" rel="noopener" title="National Football League 2026, NFL Player Health and Safety">57</a></sup>. In 2024, the league reported that returns rose 57%, while the concussion rate on the play fell 43% against the 2021 to 2023 average <sup class="cite"><a href="https://www.nfl.com/playerhealthandsafety/resources/press-releases/concussions-decrease-to-historic-low-in-2024-nfl-season" rel="noopener" title="National Football League 2025, NFL Player Health and Safety">58</a></sup>. However, the next season showed why the record has to stay open. With 1,157 more returned kickoffs, concussions on kickoffs rose from 8 to 35, although the league says the rate stayed below the old format <sup class="cite"><a href="https://www.nfl.com/playerhealthandsafety/health-and-wellness/injury-data/2025-season-key-takeaways" rel="noopener" title="National Football League 2026, NFL Player Health and Safety">59</a></sup>.

Registration data can work the same way. For instance, Portugal's registration records covered 126,285 boys and showed a birth date effect in every age group. The effect was far stronger at selection. Boys born in the first quarter of the year had 12.36 times the odds of being on the under-17 national team, against boys born in the last quarter <sup class="cite"><a href="https://www.frontiersin.org/articles/10.3389/fpsyg.2021.679476/full" rel="noopener" title="Figueiredo P 2021, Frontiers in Psychology 12:679476">60</a></sup>.

## What will more data not fix?

Three findings complicate the case for data, and they belong in this post.

First, some answers already exist and go unused. Programs that include the Nordic hamstring exercise cut hamstring injuries by about half across 8,459 athletes <sup class="cite"><a href="https://bjsm.bmj.com/lookup/doi/10.1136/bjsports-2018-100045" rel="noopener" title="van Dyk N 2019, British Journal of Sports Medicine 53(21):1362-1370">61</a></sup>. However, a survey of 50 elite men's soccer clubs found that 83.3% of club seasons did not follow the program <sup class="cite"><a href="https://bjsm.bmj.com/lookup/doi/10.1136/bjsports-2015-094826" rel="noopener" title="Bahr R 2015, British Journal of Sports Medicine 49(22):1466-1471">62</a></sup>. Meanwhile, in elite European men's soccer, hamstring injuries rose from 12% to 24% of all injuries between the 2001/02 and 2021/22 seasons <sup class="cite"><a href="https://bjsm.bmj.com/lookup/doi/10.1136/bjsports-2021-105407" rel="noopener" title="Ekstrand J 2023, British Journal of Sports Medicine 57(5):292-298">63</a></sup>.

Second, screening has a limit that volume does not remove. A 2016 review found no injury screening test with adequate accuracy. The reason is overlap, because scores for athletes who get hurt look much like scores for those who do not <sup class="cite"><a href="https://bjsm.bmj.com/lookup/doi/10.1136/bjsports-2016-096256" rel="noopener" title="Bahr R 2016, British Journal of Sports Medicine 50(13):776-780">64</a></sup>.

Third, more measurements are different from more athletes. For example, a review of 45 workload studies found that a single study tested between 1 and 336 variables <sup class="cite"><a href="https://www.jospt.org/doi/10.2519/jospt.2020.9766" rel="noopener" title="Udby CL 2020, Journal of Orthopaedic and Sports Physical Therapy 50(10):538-548">65</a></sup>. In addition, a review of 56 studies found that asking athletes how they felt tracked training load better than objective measures did <sup class="cite"><a href="https://bjsm.bmj.com/lookup/doi/10.1136/bjsports-2015-094758" rel="noopener" title="Saw AE 2016, British Journal of Sports Medicine 50(5):281-291">66</a></sup>. Professional baseball also keeps a league-wide injury tracking system. Its records show that 2,281 pitchers had elbow ligament surgery from 2010 to 2023, and the yearly number rose <sup class="cite"><a href="https://journals.sagepub.com/doi/10.1177/23259671251352199" rel="noopener" title="Meta F 2025, Orthopaedic Journal of Sports Medicine 13(7)">67</a></sup>.

## Can a phone camera replace the motion lab?

Smartphone video can collect movement data at a fraction of a motion lab's cost, since it needs no markers and no lab space. For example, the authors of one open system put a conventional lab at more than $150,000 in equipment. Their setup, by contrast, runs on two or more smartphones and costs under $700. In a field test, they collected data on 100 people in 8 hours <sup class="cite"><a href="https://dx.plos.org/10.1371/journal.pcbi.1011462" rel="noopener" title="Uhlrich SD 2023, PLoS Computational Biology 19(10):e1011462">68</a></sup>.

However, accuracy depends on the movement. That system's joint angle error averaged 4.5 degrees in 10 healthy adults <sup class="cite"><a href="https://dx.plos.org/10.1371/journal.pcbi.1011462" rel="noopener" title="Uhlrich SD 2023, PLoS Computational Biology 19(10):e1011462">68</a></sup>. In jumping, a pooled analysis of 20 studies found errors of 5.3 degrees at the hip and 4.4 at the knee <sup class="cite"><a href="https://www.tandfonline.com/doi/full/10.1080/02640414.2025.2589689" rel="noopener" title="Ogura A 2026, Journal of Sports Sciences 44(10):1275-1295">69</a></sup>. In addition, a review of 53 studies found that camera systems differed from marker systems by 0.2 to 28.6 degrees, depending on the measure <sup class="cite"><a href="https://www.tandfonline.com/doi/full/10.1080/02640414.2025.2518359" rel="noopener" title="Yoma M 2025, Journal of Sports Sciences 43(17):1703-1730">70</a></sup>. As a result, records from different systems cannot simply be mixed.

Training data for sports is scarce as well. One athlete pose dataset holds about 1.3 million frames, although all of them come from eight athletes <sup class="cite"><a href="https://arxiv.org/abs/2503.07499" rel="noopener" title="Yeung C 2025, arXiv 2503.07499">71</a></sup>. Another covers 24 people <sup class="cite"><a href="https://arxiv.org/abs/2304.01865" rel="noopener" title="Ingwersen CK 2023, arXiv 2304.01865">72</a></sup>. An open soccer event dataset, the largest when it was released in 2019, covers 1,941 matches and 4,299 players, all from men's competitions. In addition, it records events on the ball instead of movement or injury <sup class="cite"><a href="https://www.nature.com/articles/s41597-019-0247-7" rel="noopener" title="Pappalardo L 2019, Scientific Data 6(1):236">73</a></sup>.

The volume at the top of the sport is of a different order. For example, the NFL says its system uses 38 cameras in a stadium and processes about 6.8 million video frames in each week of games. Meanwhile, practices add more than 500 million tracking data points a week <sup class="cite"><a href="https://www.nfl.com/playerhealthandsafety/equipment-and-innovation/aws-partnership/building-a-digital-athlete-using-ai-to-rewrite-the-playbook-on-nfl-player-safety" rel="noopener" title="Langton J 2024, NFL Player Health and Safety">74</a></sup>.

## Who owns an athlete's data?

The rules depend on where the athlete plays. In the NFL, for example, the 2020 labor agreement states that each player owns the personal data collected by his sensors <sup class="cite"><a href="https://nflpaweb.blob.core.windows.net/website/PDFs/CBA/March-15-2020-NFL-NFLPA-Collective-Bargaining-Agreement-Final-Executed-Copy.pdf" rel="noopener" title="National Football League 2020, NFL Players Association">75</a></sup>. In the NBA, the 2023 agreement makes team wearables voluntary, while it gives a player full access to his data. It also allows a fine of up to $250,000 for a team that uses the data in contract talks <sup class="cite"><a href="https://imgix.cosmicjs.com/25da5eb0-15eb-11ee-b5b3-fbd321202bdf-Final-2023-NBA-Collective-Bargaining-Agreement-6-28-23.pdf" rel="noopener" title="National Basketball Association 2023, National Basketball Players Association">76</a></sup>.

College athletes sit under a different law. Specifically, federal guidance states that at most colleges, student health records kept by a campus clinic fall under the student privacy law known as FERPA. Therefore they are excluded from the health privacy law known as HIPAA, even when the school is covered by it <sup class="cite"><a href="https://studentprivacy.ed.gov/sites/default/files/resource_document/file/2019%20HIPAA%20FERPA%20Joint%20Guidance%20508.pdf" rel="noopener" title="US Department of Health 2019, US Department of Education, Student Privacy Policy Office">77</a></sup>. In soccer, meanwhile, the players' union and FIFA published a charter in 2022 that lists eight data rights. In the union's survey of 119 players, 80% wanted access to their own data <sup class="cite"><a href="https://www.fifpro.org/en/articles/2022/09/charter-of-player-data-rights-launched-for-professional-footballers" rel="noopener" title="FIFPRO 2022, FIFPRO">78</a></sup>.

These rules differ by league, by country and by level of play. Therefore a shared dataset has to settle consent, access and ownership before the first record is collected.

## What would a useful athlete dataset contain?

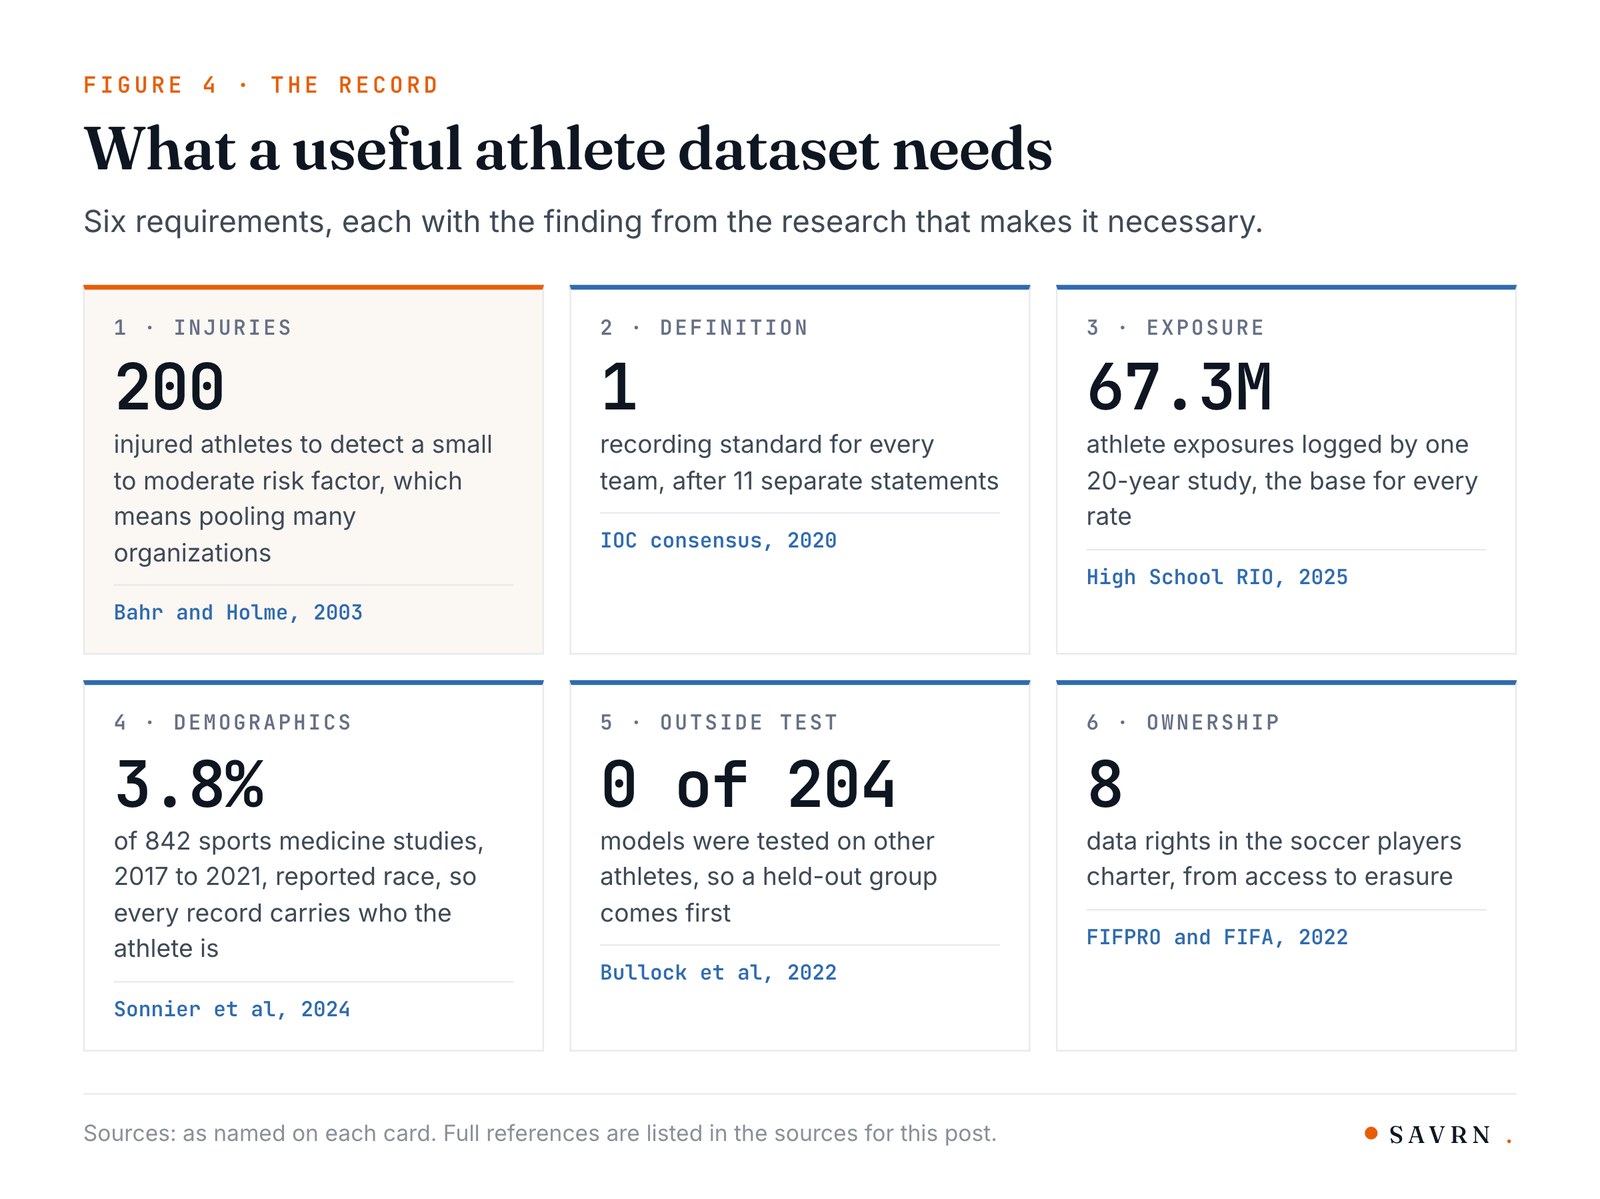
The studies above point to a short list, while Figure 4 shows the evidence behind each item.

1. Enough injuries, because detecting a small to moderate risk factor takes about 200 injured athletes. That means many organizations pooling their records <sup class="cite"><a href="https://bjsm.bmj.com/lookup/doi/10.1136/bjsm.37.5.384" rel="noopener" title="Bahr R 2003, British Journal of Sports Medicine 37(5):384-392">23</a></sup>.
2. One definition of injury. The International Olympic Committee published a recording standard in 2020, since 11 separate statements for single sports or settings had already appeared <sup class="cite"><a href="https://bjsm.bmj.com/lookup/doi/10.1136/bjsports-2019-101969" rel="noopener" title="Bahr R 2020, British Journal of Sports Medicine 54(7)">79</a></sup>.
3. Exposure counts. A rate needs a denominator. Therefore every practice and game is logged, including the ones without an injury.
4. Demographics on every record. Specifically, that means sex, age, growth stage, level of play, race, ethnicity and impairment class. Of 13 studies that analyzed race, 8 found differences in outcomes <sup class="cite"><a href="https://journals.sagepub.com/doi/10.1177/23259671241261679" rel="noopener" title="Sonnier JH 2024, Orthopaedic Journal of Sports Medicine 12(10):23259671241261679">43</a></sup>.
5. A held-out group, because a model has to be tested on athletes from a different organization before anyone relies on it <sup class="cite"><a href="https://link.springer.com/10.1007/s40279-022-01698-9" rel="noopener" title="Bullock GS 2022, Sports Medicine 52(10):2469-2482">3</a></sup>.
6. Consent and ownership in writing, settled before collection starts.

<figure class="bfig"><img src="/media/blog-athlete-performance-data-fig4-record-20260928.jpg" alt="Six cards listing what a useful athlete dataset needs, each with the number from the research behind it" loading="lazy"><figcaption>Figure 4. Six requirements for a useful athlete dataset, each with the finding behind it.</figcaption></figure>

## How SAVRN is approaching this

We build AI factories, so our part of this problem is the computing and the control of the data. Both are large. For example, the smartphone system above needed 31 hours of computing for 100 people, which is about 19 minutes each <sup class="cite"><a href="https://dx.plos.org/10.1371/journal.pcbi.1011462" rel="noopener" title="Uhlrich SD 2023, PLoS Computational Biology 19(10):e1011462">68</a></sup>. Therefore one session for each of the 554,298 NCAA athletes would take about 172,000 hours on the same machine. That is more than 19 years, so the work has to run in parallel on far more capacity.

Control matters as much as capacity. In September we wrote about why we [train a model on our own data](/blog/train-a-model-on-your-own-data) instead of handing the data over. The same choice applies to athlete records, since they are health records about named people. Likewise, our [university AI infrastructure](/university-ai-infrastructure) work starts with the institution deciding where data can go and who can use it. In addition, our [dataset catalog](/datasets) listed 1,578 open datasets with their licenses on September 27, 2026, because a model can only be traced if its data can be.

We set out the principle behind that work, and a design case for athlete development, in [Data to Intelligence](/data-to-intelligence). The project we are looking at is at an early stage, and nothing is announced. However, the record above sets the terms for it. First, the dataset would pool many organizations, because no single team records 200 athletes with one specific injury, such as an ACL tear, on its own. Second, it would cover women, para athletes and growing young athletes from the first day, since the current record is thin on all three. Third, it would test every model on outside athletes before use. Finally, it would be measured by injuries prevented, because prediction alone has not been shown to protect athletes.

## Frequently asked questions

### What is athlete performance data?
It is any record of how an athlete trains, moves, recovers and gets hurt. For example, it includes GPS and sensor readings, video, strength tests, sleep, wellness surveys and injury reports. However, a record only becomes evidence when many athletes are recorded the same way.

### Is there really no data behind athletic performance?
There is data, although it is thin where decisions are made. For instance, one review reported a median sample size of 19 in the Journal of Sports Sciences. In addition, a review of 204 injury prediction models found none tested on outside athletes.

### Can AI predict sports injuries today?
Not reliably. The largest ACL cohort in a team ball sport analyzed 791 elite female players, while its best model scored 0.63 where 0.5 is a coin flip. In addition, a 2022 review of 204 injury prediction models could not recommend any model for use in practice.

### Why are women missing from sports science data?
The published record leans toward men's sport. Specifically, an audit of 5,261 publications in six sport science journals found that 6% studied women only, while 31% studied men only. Because of that, many findings have only been shown in men.

### How many athletes does a good study need?
It depends on injuries instead of head count. A study needs 20 to 50 injury cases to detect a moderate to strong risk factor, while it needs about 200 injured athletes for a small to moderate one. Therefore a rare injury means pooling many teams.

### What is the acute to chronic workload ratio?
It compares this week's training load with the average of recent weeks. A 2016 review called 0.8 to 1.3 the sweet spot. However, a randomized trial in 482 youth soccer players found no benefit from managing load by the ratio.

### Does more data always lead to fewer injuries?
No. A proven hamstring program cuts hamstring injuries by about half, while 83.3% of elite men's club seasons did not follow it. Therefore some problems are about using what is already known.

### Can a phone replace a motion capture lab?
For some movements it can. For example, one open system costs under $700 and measured joint angles with an average error of 4.5 degrees in 10 healthy adults. However, errors are larger in jumping, and results from different systems cannot simply be mixed.

### Who owns the data from an athlete's wearable?
It depends on the league and the law. For example, NFL players own their sensor data under their 2020 agreement. For college athletes in the United States, health records kept by a campus clinic fall under FERPA instead of HIPAA at most colleges.

### What is SAVRN building in this area?
Nothing is announced. SAVRN builds AI factories, while it is looking at a project in athletic performance. This review sets the terms for it, specifically pooled records, full demographic coverage, outside testing and clear ownership.

<details class="bsrc">
<summary>Sources</summary>
<ol>
<li id="src-1"><a href="https://bjsm.bmj.com/lookup/doi/10.1136/bjsports-2013-092524" rel="noopener">Spikes in acute workload are associated with increased injury risk in elite cricket fast bowlers</a>, Hulin BT et al, British Journal of Sports Medicine 48(8):708-712, 2014; Cohort of 28 elite fast bowlers over 43 player seasons; The first workload ratio study (<a href="https://doi.org/10.1136/bjsports-2013-092524" rel="noopener">DOI</a>)</li>
<li id="src-2"><a href="https://dx.plos.org/10.1371/journal.pone.0201264" rel="noopener">Effective injury forecasting in soccer with GPS training data and machine learning</a>, Rossi A et al, PLoS ONE 13(7):e0201264, 2018; One Italian club, 26 players, 23 non-contact injuries, 23 weeks of GPS data (<a href="https://doi.org/10.1371/journal.pone.0201264" rel="noopener">DOI</a>)</li>
<li id="src-3"><a href="https://link.springer.com/10.1007/s40279-022-01698-9" rel="noopener">Just How Confident Can We Be in Predicting Sports Injuries? A Systematic Review of the Methodological Conduct and Performance of Existing Musculoskeletal Injury Prediction Models in Sport</a>, Bullock GS et al, Sports Medicine 52(10):2469-2482, 2022; Systematic review of 30 studies and 204 prediction models, searched to June 2021 (<a href="https://doi.org/10.1007/s40279-022-01698-9" rel="noopener">DOI</a>)</li>
<li id="src-4"><a href="https://www.nfhs.org/articles/participation-in-high-school-sports-hits-record-high-with-sizable-increase-in-2024-25/" rel="noopener">Participation in High School Sports Hits Record High with Sizable Increase in 2024-25</a>, National Federation of State High School Associations, NFHS, 2025; Annual participation survey of state high school associations; Counts participations, so an athlete in two sports counts twice</li>
<li id="src-5"><a href="https://www.ncaa.org/media-center-a-record-number-of-ncaa-student-athletes-participated-in-2024-25/" rel="noopener">A record number of NCAA student-athletes participated in 2024-25</a>, National Collegiate Athletic Association, NCAA.org, 2025; NCAA participation report for championship sports, published September 15, 2025</li>
<li id="src-6"><a href="https://pubmed.ncbi.nlm.nih.gov/27906643/" rel="noopener">Sports- and Recreation-related Injury Episodes in the United States, 2011-2014</a>, Sheu Y et al, National Health Statistics Reports 99, 2016; National Health Interview Survey, 2011 to 2014, National Center for Health Statistics report no; 99</li>
<li id="src-7"><a href="https://www.howdengroup.com/de-en/202425-mens-european-football-injury-index" rel="noopener">2024/25 Men&#x27;s European Football Injury Index</a>, Howden, Howden, 2025; Insurance broker&#x27;s annual index of injuries in the top five men&#x27;s leagues; Published December 2025</li>
<li id="src-8"><a href="https://bmjopensem.bmj.com/lookup/doi/10.1136/bmjsem-2019-000675" rel="noopener">Estimation of injury costs: financial damage of English Premier League teams&#x27; underachievement due to injuries</a>, Eliakim E et al, BMJ Open Sport and Exercise Medicine 6(1), 2020; Five Premier League seasons, 2012/13 to 2016/17; The authors call the estimate a heuristic model (<a href="https://doi.org/10.1136/bmjsem-2019-000675" rel="noopener">DOI</a>)</li>
<li id="src-9"><a href="https://bjsm.bmj.com/lookup/doi/10.1136/bjsports-2013-092215" rel="noopener">Injuries affect team performance negatively in professional football: an 11-year follow-up of the UEFA Champions League injury study</a>, Hagglund M et al, British Journal of Sports Medicine 47(12):738-742, 2013; Prospective cohort of 24 clubs in 9 countries over 11 seasons, 7,792 injuries (<a href="https://doi.org/10.1136/bjsports-2013-092215" rel="noopener">DOI</a>)</li>
<li id="src-10"><a href="https://link.springer.com/10.1007/s40279-023-01849-6" rel="noopener">The Trade Secret Taboo: Open Science Methods are Required to Improve Prediction Models in Sports Medicine and Performance</a>, Bullock GS et al, Sports Medicine 53(10):1841-1849, 2023; Opinion article on data sharing and external validation in sports prediction models (<a href="https://doi.org/10.1007/s40279-023-01849-6" rel="noopener">DOI</a>)</li>
<li id="src-11"><a href="https://bjsm.bmj.com/lookup/doi/10.1136/bjsports-2015-095788" rel="noopener">The training-injury prevention paradox: should athletes be training smarter and harder?</a>, Gabbett TJ, British Journal of Sports Medicine 50(5):273-280, 2016; Narrative review that proposed the 0.8 to 1.3 range; Open access full text (<a href="https://doi.org/10.1136/bjsports-2015-095788" rel="noopener">DOI</a>)</li>
<li id="src-12"><a href="https://bjsm.bmj.com/lookup/doi/10.1136/bjsports-2016-096581" rel="noopener">How much is too much? (Part 1) International Olympic Committee consensus statement on load in sport and risk of injury</a>, Soligard T et al, British Journal of Sports Medicine 50(17):1030-1041 (International Olympic Committee), 2016; Consensus statement built on 104 publications; Read as the accepted manuscript (<a href="https://doi.org/10.1136/bjsports-2016-096581" rel="noopener">DOI</a>)</li>
<li id="src-13"><a href="https://bjsm.bmj.com/lookup/doi/10.1136/bjsports-2015-094817" rel="noopener">The acute:chronic workload ratio predicts injury: high chronic workload may decrease injury risk in elite rugby league players</a>, Hulin BT et al, British Journal of Sports Medicine 50(4):231-236, 2016; Cohort of 53 elite rugby league players over two seasons at one club (<a href="https://doi.org/10.1136/bjsports-2015-094817" rel="noopener">DOI</a>)</li>
<li id="src-14"><a href="https://link.springer.com/10.1007/s40279-020-01308-6" rel="noopener">Is the Acute: Chronic Workload Ratio (ACWR) Associated with Risk of Time-Loss Injury in Professional Team Sports? A Systematic Review of Methodology, Variables and Injury Risk in Practical Situations</a>, Andrade R et al, Sports Medicine 50(9):1613-1635, 2020; Systematic review of 20 studies, 1,234 athletes and 2,375 injuries, all male (<a href="https://doi.org/10.1007/s40279-020-01308-6" rel="noopener">DOI</a>)</li>
<li id="src-15"><a href="https://bjsm.bmj.com/lookup/doi/10.1136/bjsports-2020-103003" rel="noopener">Does load management using the acute:chronic workload ratio prevent health problems? A cluster randomised trial of 482 elite youth footballers of both sexes</a>, Dalen-Lorentsen T et al, British Journal of Sports Medicine 55(2):108-114, 2021; Cluster randomized trial, 34 teams, 482 players, 10 months, Norway (<a href="https://doi.org/10.1136/bjsports-2020-103003" rel="noopener">DOI</a>)</li>
<li id="src-16"><a href="https://link.springer.com/10.1007/s40279-020-01378-6" rel="noopener">What Role Do Chronic Workloads Play in the Acute to Chronic Workload Ratio? Time to Dismiss ACWR and Its Underlying Theory</a>, Impellizzeri FM et al, Sports Medicine 51(3):581-592, 2021; Re-analysis of published soccer data with fixed and random chronic loads (<a href="https://doi.org/10.1007/s40279-020-01378-6" rel="noopener">DOI</a>)</li>
<li id="src-17"><a href="https://linkinghub.elsevier.com/retrieve/pii/S1440244024005243" rel="noopener">The intention-to-treat effect of changes in planned participation on injury risk in adolescent ice hockey players: A target trial emulation</a>, Wang C et al, Journal of Science and Medicine in Sport 28(2):132-139, 2025; Five-year cohort of 2,633 players aged 13 to 17, analyzed as a target trial (<a href="https://doi.org/10.1016/j.jsams.2024.09.007" rel="noopener">DOI</a>)</li>
<li id="src-18"><a href="https://pubmed.ncbi.nlm.nih.gov/25028798/" rel="noopener">Chronic lack of sleep is associated with increased sports injuries in adolescent athletes</a>, Milewski MD et al, Journal of Pediatric Orthopaedics 34(2):129-133, 2014; Survey of 112 athletes in grades 7 to 12 at one school (<a href="https://doi.org/10.1097/BPO.0000000000000151" rel="noopener">DOI</a>)</li>
<li id="src-19"><a href="https://link.springer.com/10.1007/s40279-020-01416-3" rel="noopener">The Association Between Poor Sleep and the Incidence of Sport and Physical Training-Related Injuries in Adult Athletic Populations: A Systematic Review</a>, Dobrosielski DA et al, Sports Medicine 51(4):777-793, 2021; Systematic review of 12 prospective cohort studies in adult athletes (<a href="https://doi.org/10.1007/s40279-020-01416-3" rel="noopener">DOI</a>)</li>
<li id="src-20"><a href="https://linkinghub.elsevier.com/retrieve/pii/S1440244021001080" rel="noopener">Monitoring and adapting endurance training on the basis of heart rate variability monitored by wearable technologies: A systematic review with meta-analysis</a>, Duking P et al, Journal of Science and Medicine in Sport 24(11):1180-1192, 2021; Meta-analysis of 8 studies and 198 participants (<a href="https://doi.org/10.1016/j.jsams.2021.04.012" rel="noopener">DOI</a>)</li>
<li id="src-21"><a href="https://royalsocietypublishing.org/doi/10.1098/rsos.220946" rel="noopener">Replication concerns in sports and exercise science: a narrative review of selected methodological issues in the field</a>, Mesquida C et al, Royal Society Open Science 9(12):220946, 2022; Narrative review; The 12 of 120 figure and the median of 19 are cited there from a 2020 journal editorial (<a href="https://doi.org/10.1098/rsos.220946" rel="noopener">DOI</a>)</li>
<li id="src-22"><a href="https://link.springer.com/10.1007/s40279-025-02201-w" rel="noopener">Estimating the Replicability of Sports and Exercise Science Research</a>, Murphy J et al, Sports Medicine 55(10):2659-2679, 2025; Replication of 25 studies published in top quartile journals from 2016 to 2021 (<a href="https://doi.org/10.1007/s40279-025-02201-w" rel="noopener">DOI</a>)</li>
<li id="src-23"><a href="https://bjsm.bmj.com/lookup/doi/10.1136/bjsm.37.5.384" rel="noopener">Risk factors for sports injuries: a methodological approach</a>, Bahr R and Holme I, British Journal of Sports Medicine 37(5):384-392, 2003; Methods paper that set out how many injury cases a risk factor study needs (<a href="https://doi.org/10.1136/bjsm.37.5.384" rel="noopener">DOI</a>)</li>
<li id="src-24"><a href="https://journals.sagepub.com/doi/10.1177/0363546504269591" rel="noopener">Biomechanical measures of neuromuscular control and valgus loading of the knee predict anterior cruciate ligament injury risk in female athletes: a prospective study</a>, Hewett TE et al, American Journal of Sports Medicine 33(4):492-501, 2005; Prospective cohort of 205 female athletes with 9 ACL injuries (<a href="https://doi.org/10.1177/0363546504269591" rel="noopener">DOI</a>)</li>
<li id="src-25"><a href="https://journals.sagepub.com/doi/10.1177/0363546515625048" rel="noopener">The Vertical Drop Jump Is a Poor Screening Test for ACL Injuries in Female Elite Soccer and Handball Players: A Prospective Cohort Study of 710 Athletes</a>, Krosshaug T et al, American Journal of Sports Medicine 44(4):874-883, 2016; Prospective cohort of 710 elite players in Norway, 2007 to 2014, with 42 new noncontact ACL injuries (<a href="https://doi.org/10.1177/0363546515625048" rel="noopener">DOI</a>)</li>
<li id="src-26"><a href="https://www.thieme-connect.de/DOI/DOI?10.1055/a-0826-1955" rel="noopener">A Preventive Model for Hamstring Injuries in Professional Soccer: Learning Algorithms</a>, Ayala F et al, International Journal of Sports Medicine 40(5):344-353, 2019; 96 professional players and 18 hamstring injuries in one season (<a href="https://doi.org/10.1055/a-0826-1955" rel="noopener">DOI</a>)</li>
<li id="src-27"><a href="https://pubmed.ncbi.nlm.nih.gov/29283933/" rel="noopener">A Preventive Model for Muscle Injuries: A Novel Approach based on Learning Algorithms</a>, López-Valenciano A et al, Medicine and Science in Sports and Exercise 50(5):915-927, 2018; 132 professional soccer and handball players and 32 muscle injuries (<a href="https://doi.org/10.1249/MSS.0000000000001535" rel="noopener">DOI</a>)</li>
<li id="src-28"><a href="https://www.tandfonline.com/doi/full/10.1080/24733938.2022.2095006" rel="noopener">Forecasting football injuries by combining screening, monitoring and machine learning</a>, Hecksteden A et al, Science and Medicine in Football 7(3):214-228, 2023; 88 professional players from 4 teams and 51 non-contact injuries (<a href="https://doi.org/10.1080/24733938.2022.2095006" rel="noopener">DOI</a>)</li>
<li id="src-29"><a href="https://bjsm.bmj.com/lookup/doi/10.1136/bjsports-2016-096274" rel="noopener">&quot;What&#x27;s my risk of sustaining an ACL injury while playing sports?&quot; A systematic review with meta-analysis</a>, Montalvo AM et al, British Journal of Sports Medicine 53(16):1003-1012, 2019; Meta-analysis of 58 studies of ACL incidence by sex and sport (<a href="https://doi.org/10.1136/bjsports-2016-096274" rel="noopener">DOI</a>)</li>
<li id="src-30"><a href="https://link.springer.com/10.1186/s12911-026-03615-w" rel="noopener">Artificial intelligence and machine learning in sports medicine: mapping clinical tasks and assessing clinical maturity - a scoping review</a>, Lindskog J et al, BMC Medical Informatics and Decision Making 26(1), 2026; Scoping review of 97 studies of AI in sports medicine (<a href="https://doi.org/10.1186/s12911-026-03615-w" rel="noopener">DOI</a>)</li>
<li id="src-31"><a href="https://esskajournals.onlinelibrary.wiley.com/doi/10.1186/s40634-021-00346-x" rel="noopener">Machine learning methods in sport injury prediction and prevention: a systematic review</a>, Van Eetvelde H et al, Journal of Experimental Orthopaedics 8(1):27, 2021; Systematic review of 11 machine learning studies (<a href="https://doi.org/10.1186/s40634-021-00346-x" rel="noopener">DOI</a>)</li>
<li id="src-32"><a href="https://pubmed.ncbi.nlm.nih.gov/29266094/" rel="noopener">Predictive Modeling of Hamstring Strain Injuries in Elite Australian Footballers</a>, Ruddy JD et al, Medicine and Science in Sports and Exercise 50(5):906-914, 2018; Two seasons of elite Australian footballers, 186 and 176 players (<a href="https://doi.org/10.1249/MSS.0000000000001527" rel="noopener">DOI</a>)</li>
<li id="src-33"><a href="https://journals.sagepub.com/doi/10.1177/03635465221112095" rel="noopener">Predicting ACL Injury Using Machine Learning on Data From an Extensive Screening Test Battery of 880 Female Elite Athletes</a>, Jauhiainen S et al, American Journal of Sports Medicine 50(11):2917-2924, 2022; 880 players tested, 791 analyzed, 60 ACL injuries, 283 variables (<a href="https://doi.org/10.1177/03635465221112095" rel="noopener">DOI</a>)</li>
<li id="src-34"><a href="https://www.thieme-connect.de/DOI/DOI?10.1055/a-1231-5304" rel="noopener">New Machine Learning Approach for Detection of Injury Risk Factors in Young Team Sport Athletes</a>, Jauhiainen S et al, International Journal of Sports Medicine 42(2):175-182, 2021; 314 youth basketball and floorball players followed for three years, 57 injuries (<a href="https://doi.org/10.1055/a-1231-5304" rel="noopener">DOI</a>)</li>
<li id="src-35"><a href="https://journals.sagepub.com/doi/10.1177/19417381261457613" rel="noopener">Can Field-Based Screening Predict ACL Injury Risk in Women Footballers? External Validation of a Prediction Model</a>, Lopes Lima Y et al, Sports Health, 2026; External validation in 320 female Australian football and soccer players, then refit on 642 (<a href="https://doi.org/10.1177/19417381261457613" rel="noopener">DOI</a>)</li>
<li id="src-36"><a href="https://linkinghub.elsevier.com/retrieve/pii/S2059775426000246" rel="noopener">Comparisons of machine learning models to logistic regression in orthopedic sports medicine are confounded by methodological heterogeneity: a systematic review and meta-analysis</a>, Lu Y et al, Journal of ISAKOS 17:101088, 2026; Meta-analysis of 168 head-to-head comparisons from 25 studies (<a href="https://doi.org/10.1016/j.jisako.2026.101088" rel="noopener">DOI</a>)</li>
<li id="src-37"><a href="https://journals.humankinetics.com/view/journals/wspaj/29/2/article-p146.xml" rel="noopener">&quot;Invisible Sportswomen&quot;: The Sex Data Gap in Sport and Exercise Science Research</a>, Cowley ES et al, Women in Sport and Physical Activity Journal 29(2):146-151, 2021; Audit of 5,261 publications and 12,511,386 participants in six journals, 2014 to 2020 (<a href="https://doi.org/10.1123/wspaj.2021-0028" rel="noopener">DOI</a>)</li>
<li id="src-38"><a href="https://sportsmedicine-open.springeropen.com/articles/10.1186/s40798-019-0202-3" rel="noopener">Current Approaches to the Use of Artificial Intelligence for Injury Risk Assessment and Performance Prediction in Team Sports: a Systematic Review</a>, Claudino JG et al, Sports Medicine - Open 5(1):28, 2019; Systematic review of 58 studies and 6,456 participants across 12 team sports (<a href="https://doi.org/10.1186/s40798-019-0202-3" rel="noopener">DOI</a>)</li>
<li id="src-39"><a href="https://www.tandfonline.com/doi/full/10.1080/24733938.2025.2577442" rel="noopener">Auditing the representation of elite female players in football performance and injury research</a>, Clausen E et al, Science and Medicine in Football 10(3):358-373, 2026; Audit of 722 studies of elite soccer performance and injury (<a href="https://doi.org/10.1080/24733938.2025.2577442" rel="noopener">DOI</a>)</li>
<li id="src-40"><a href="https://journals.sagepub.com/doi/10.1177/0363546520959619" rel="noopener">Anterior Cruciate Ligament Injury Incidence in Adolescent Athletes: A Systematic Review and Meta-analysis</a>, Bram JT et al, American Journal of Sports Medicine 49(7):1962-1972, 2021; Meta-analysis covering 1,235 ACL injuries over 17,824,251 athlete exposures (<a href="https://doi.org/10.1177/0363546520959619" rel="noopener">DOI</a>)</li>
<li id="src-41"><a href="https://publications.aap.org/pediatrics/article/144/5/e20192180/38225/Concussion-Incidence-and-Trends-in-20-High-School" rel="noopener">Concussion Incidence and Trends in 20 High School Sports</a>, Kerr ZY et al, Pediatrics 144(5), 2019; High School RIO surveillance data, 2013-14 to 2017-18, 9,542 concussions (<a href="https://doi.org/10.1542/peds.2019-2180" rel="noopener">DOI</a>)</li>
<li id="src-42"><a href="https://www.nature.com/articles/s41598-026-36763-0" rel="noopener">The influence of the menstrual cycle on muscle injuries - a systematic review and meta-analysis</a>, Guthardt Y et al, Scientific Reports 16(1):3035, 2026; Meta-analysis that found 3 eligible studies with 318 participants (<a href="https://doi.org/10.1038/s41598-026-36763-0" rel="noopener">DOI</a>)</li>
<li id="src-43"><a href="https://journals.sagepub.com/doi/10.1177/23259671241261679" rel="noopener">Rates of Reporting and Analyzing Race and Ethnicity in Athlete-Specific Sports Medicine Research: A Systematic Review</a>, Sonnier JH et al, Orthopaedic Journal of Sports Medicine 12(10):23259671241261679, 2024; Systematic review of 842 athlete studies in three journals, 2017 to 2021 (<a href="https://doi.org/10.1177/23259671241261679" rel="noopener">DOI</a>)</li>
<li id="src-44"><a href="https://journals.physiology.org/doi/10.1152/ajpheart.00897.2025" rel="noopener">Female athlete representation in exercise-induced cardiac adaptation research: a systematic review and audit of the literature</a>, Henley-Martin SR et al, American Journal of Physiology - Heart and Circulatory Physiology 330(4):H1302-H1318, 2026; Audit of 767 studies and 94,744 participants (<a href="https://doi.org/10.1152/ajpheart.00897.2025" rel="noopener">DOI</a>)</li>
<li id="src-45"><a href="https://bjsm.bmj.com/lookup/doi/10.1136/bjsports-2025-109980" rel="noopener">Injury and illness epidemiology in elite athletes during the Olympic, Youth Olympic and Paralympic Games: a systematic review and meta-analysis</a>, Torvaldsson K et al, British Journal of Sports Medicine 59(18):1302-1314, 2025; Meta-analysis of 27 studies from Olympic, Youth Olympic and Paralympic Games (<a href="https://doi.org/10.1136/bjsports-2025-109980" rel="noopener">DOI</a>)</li>
<li id="src-46"><a href="https://mhealth.jmir.org/2026/1/e87324" rel="noopener">The Representation of Different Populations in Studies Assessing the Validity of Consumer Wearable Photoplethysmography-Based Measurements: Scoping Review</a>, Schipper RM et al, JMIR mHealth and uHealth 14:e87324, 2026; Scoping review of 186 validation studies of consumer wearables (<a href="https://doi.org/10.2196/87324" rel="noopener">DOI</a>)</li>
<li id="src-47"><a href="https://onlinelibrary.wiley.com/doi/10.1080/17461391.2019.1633416" rel="noopener">Growing pains: Maturity associated variation in injury risk in academy football</a>, Johnson DM et al, European Journal of Sport Science 20(4):544-552, 2020; 76 academy soccer players in England over two seasons (<a href="https://doi.org/10.1080/17461391.2019.1633416" rel="noopener">DOI</a>)</li>
<li id="src-48"><a href="https://www.thieme-connect.de/DOI/DOI?10.1055/s-0033-1349874" rel="noopener">Sport injuries aligned to peak height velocity in talented pubertal soccer players</a>, van der Sluis A et al, International Journal of Sports Medicine 35(4):351-355, 2014; 26 talented youth players followed for three years (<a href="https://doi.org/10.1055/s-0033-1349874" rel="noopener">DOI</a>)</li>
<li id="src-49"><a href="https://linkinghub.elsevier.com/retrieve/pii/S1440244020307362" rel="noopener">Injuries according to the percentage of adult height in an elite soccer academy</a>, Monasterio X et al, Journal of Science and Medicine in Sport 24(3):218-223, 2021; 63 academy players at one Spanish club, 1998 to 2019, 509 injuries (<a href="https://doi.org/10.1016/j.jsams.2020.08.004" rel="noopener">DOI</a>)</li>
<li id="src-50"><a href="https://linkinghub.elsevier.com/retrieve/pii/S1440244009001789" rel="noopener">Factors associated with increased propensity for hamstring injury in English Premier League soccer players</a>, Henderson G et al, Journal of Science and Medicine in Sport 13(4):397-402, 2010; 36 players at one Premier League club over one season (<a href="https://doi.org/10.1016/j.jsams.2009.08.003" rel="noopener">DOI</a>)</li>
<li id="src-51"><a href="https://journals.sagepub.com/doi/10.1177/0363546512470634" rel="noopener">Risk factors for lower extremity muscle injury in professional soccer: the UEFA Injury Study</a>, Hagglund M et al, American Journal of Sports Medicine 41(2):327-335, 2013; 1,401 players from 26 clubs, 2001 to 2010, 2,123 muscle injuries (<a href="https://doi.org/10.1177/0363546512470634" rel="noopener">DOI</a>)</li>
<li id="src-52"><a href="https://bjsm.bmj.com/lookup/doi/10.1136/bjsports-2020-103159" rel="noopener">Injury rates decreased in men&#x27;s professional football: an 18-year prospective cohort study of almost 12 000 injuries sustained during 1.8 million hours of play</a>, Ekstrand J et al, British Journal of Sports Medicine 55(19):1084-1091, 2021; 49 teams in 19 countries over 18 seasons, 3,302 players and 11,820 injuries (<a href="https://doi.org/10.1136/bjsports-2020-103159" rel="noopener">DOI</a>)</li>
<li id="src-53"><a href="https://www.miaa.net/sites/default/files/2025-11/sports-medicine-2024-25-high-school-rio-brief-summary-report-august-2025-final.pdf" rel="noopener">Brief Summary Report: 2024/25 National High School Sports-Related Injury Surveillance Study</a>, Collins C, National High School Sports-Related Injury Surveillance Study, 2025; Twenty years of the national high school injury surveillance study, prepared for the NFHS; Read from a copy posted by a state athletic association</li>
<li id="src-54"><a href="https://careconsortium.net/" rel="noopener">CARE Consortium home page</a>, NCAA and US Department of Defense CARE Consortium, careconsortium.net, 2025; Consortium home page, read September 27, 2026</li>
<li id="src-55"><a href="https://bjsm.bmj.com/lookup/doi/10.1136/bjsports-2020-103316" rel="noopener">Differences in sport-related concussion for female and male athletes in comparable collegiate sports: a study from the NCAA-DoD Concussion Assessment, Research and Education (CARE) Consortium</a>, Master CL et al, British Journal of Sports Medicine 55(24):1387-1394, 2021; 1,071 concussions in sports played by both sexes, enrolled 2014 to 2017 (<a href="https://doi.org/10.1136/bjsports-2020-103316" rel="noopener">DOI</a>)</li>
<li id="src-56"><a href="https://jama.jamanetwork.com/article.aspx?doi=10.1001/jama.2018.14165" rel="noopener">Association Between the Experimental Kickoff Rule and Concussion Rates in Ivy League Football</a>, Wiebe DJ et al, JAMA 320(19), 2018; Before and after study of 68,479 plays and 159 concussions, 2013 to 2017 (<a href="https://doi.org/10.1001/jama.2018.14165" rel="noopener">DOI</a>)</li>
<li id="src-57"><a href="https://www.nfl.com/playerhealthandsafety/equipment-and-innovation/aws-partnership/advancing-player-health-and-safety-with-the-digital-athlete" rel="noopener">Advancing Player Health and Safety with the Digital Athlete</a>, National Football League, NFL Player Health and Safety, 2026; League description of its own program, dated January 11, 2026; It gives no accuracy figures</li>
<li id="src-58"><a href="https://www.nfl.com/playerhealthandsafety/resources/press-releases/concussions-decrease-to-historic-low-in-2024-nfl-season" rel="noopener">Concussions Decrease to Historic Low in 2024 NFL Season</a>, National Football League, NFL Player Health and Safety, 2025; League press release, January 30, 2025</li>
<li id="src-59"><a href="https://www.nfl.com/playerhealthandsafety/health-and-wellness/injury-data/2025-season-key-takeaways" rel="noopener">2025 Season Key Takeaways</a>, National Football League, NFL Player Health and Safety, 2026; League summary of its 2025 season injury data, dated February 2, 2026</li>
<li id="src-60"><a href="https://www.frontiersin.org/articles/10.3389/fpsyg.2021.679476/full" rel="noopener">Are Soccer and Futsal Affected by the Relative Age Effect? The Portuguese Football Association Case</a>, Figueiredo P et al, Frontiers in Psychology 12:679476, 2021; National registration records for 126,285 male and 5,306 female youth soccer players, 2019-2020 (<a href="https://doi.org/10.3389/fpsyg.2021.679476" rel="noopener">DOI</a>)</li>
<li id="src-61"><a href="https://bjsm.bmj.com/lookup/doi/10.1136/bjsports-2018-100045" rel="noopener">Including the Nordic hamstring exercise in injury prevention programmes halves the rate of hamstring injuries: a systematic review and meta-analysis of 8459 athletes</a>, van Dyk N et al, British Journal of Sports Medicine 53(21):1362-1370, 2019; Meta-analysis of 15 studies and 8,459 athletes (<a href="https://doi.org/10.1136/bjsports-2018-100045" rel="noopener">DOI</a>)</li>
<li id="src-62"><a href="https://bjsm.bmj.com/lookup/doi/10.1136/bjsports-2015-094826" rel="noopener">Evidence-based hamstring injury prevention is not adopted by the majority of Champions League or Norwegian Premier League football teams: the Nordic Hamstring survey</a>, Bahr R et al, British Journal of Sports Medicine 49(22):1466-1471, 2015; Survey of 50 elite clubs covering 150 club seasons (<a href="https://doi.org/10.1136/bjsports-2015-094826" rel="noopener">DOI</a>)</li>
<li id="src-63"><a href="https://bjsm.bmj.com/lookup/doi/10.1136/bjsports-2021-105407" rel="noopener">Hamstring injury rates have increased during recent seasons and now constitute 24% of all injuries in men&#x27;s professional football: the UEFA Elite Club Injury Study from 2001/02 to 2021/22</a>, Ekstrand J et al, British Journal of Sports Medicine 57(5):292-298, 2023; 54 teams over 21 seasons, 3,909 players and 2,636 hamstring injuries (<a href="https://doi.org/10.1136/bjsports-2021-105407" rel="noopener">DOI</a>)</li>
<li id="src-64"><a href="https://bjsm.bmj.com/lookup/doi/10.1136/bjsports-2016-096256" rel="noopener">Why screening tests to predict injury do not work-and probably never will...: a critical review</a>, Bahr R, British Journal of Sports Medicine 50(13):776-780, 2016; Critical review of injury screening tests (<a href="https://doi.org/10.1136/bjsports-2016-096256" rel="noopener">DOI</a>)</li>
<li id="src-65"><a href="https://www.jospt.org/doi/10.2519/jospt.2020.9766" rel="noopener">How Has Workload Been Defined and How Many Workload-Related Exposures to Injury Are Included in Published Sports Injury Articles? A Scoping Review</a>, Udby CL et al, Journal of Orthopaedic and Sports Physical Therapy 50(10):538-548, 2020; Scoping review of 45 prospective workload and injury studies (<a href="https://doi.org/10.2519/jospt.2020.9766" rel="noopener">DOI</a>)</li>
<li id="src-66"><a href="https://bjsm.bmj.com/lookup/doi/10.1136/bjsports-2015-094758" rel="noopener">Monitoring the athlete training response: subjective self-reported measures trump commonly used objective measures: a systematic review</a>, Saw AE et al, British Journal of Sports Medicine 50(5):281-291, 2016; Systematic review of 56 studies that used subjective and objective measures together (<a href="https://doi.org/10.1136/bjsports-2015-094758" rel="noopener">DOI</a>)</li>
<li id="src-67"><a href="https://journals.sagepub.com/doi/10.1177/23259671251352199" rel="noopener">Epidemiology of Elbow Medial Ulnar Collateral Ligament Surgeries in Major and Minor League Baseball Pitchers: A Descriptive Study of 2281 Cases</a>, Meta F et al, Orthopaedic Journal of Sports Medicine 13(7), 2025; Case series from the league&#x27;s Health and Injury Tracking System, 2010 to 2023 (<a href="https://doi.org/10.1177/23259671251352199" rel="noopener">DOI</a>)</li>
<li id="src-68"><a href="https://dx.plos.org/10.1371/journal.pcbi.1011462" rel="noopener">OpenCap: Human movement dynamics from smartphone videos</a>, Uhlrich SD et al, PLoS Computational Biology 19(10):e1011462, 2023; Validation in 10 healthy adults and a field study of 100 people; Open access (<a href="https://doi.org/10.1371/journal.pcbi.1011462" rel="noopener">DOI</a>)</li>
<li id="src-69"><a href="https://www.tandfonline.com/doi/full/10.1080/02640414.2025.2589689" rel="noopener">Are we there yet? A systematic review and meta-analysis of the validity and reliability of automated markerless motion capture systems during jumping tasks</a>, Ogura A et al, Journal of Sports Sciences 44(10):1275-1295, 2026; Meta-analysis of 20 studies of camera systems in jumping tasks (<a href="https://doi.org/10.1080/02640414.2025.2589689" rel="noopener">DOI</a>)</li>
<li id="src-70"><a href="https://www.tandfonline.com/doi/full/10.1080/02640414.2025.2518359" rel="noopener">Reliability and validity of lower extremity and trunk kinematics measured with markerless motion capture during sports-related and functional tasks: A systematic review</a>, Yoma M et al, Journal of Sports Sciences 43(17):1703-1730, 2025; Systematic review of 53 studies in sports and functional tasks (<a href="https://doi.org/10.1080/02640414.2025.2518359" rel="noopener">DOI</a>)</li>
<li id="src-71"><a href="https://arxiv.org/abs/2503.07499" rel="noopener">AthletePose3D: A Benchmark Dataset for 3D Human Pose Estimation and Kinematic Validation in Athletic Movements</a>, Yeung C et al, arXiv 2503.07499, 2025; Preprint; About 1.3 million frames from eight athletes in running, track and field and figure skating</li>
<li id="src-72"><a href="https://arxiv.org/abs/2304.01865" rel="noopener">SportsPose: A Dynamic 3D Sports Pose Dataset</a>, Ingwersen CK et al, arXiv 2304.01865, 2023; Preprint; More than 176,000 poses from 24 people in 5 sports activities</li>
<li id="src-73"><a href="https://www.nature.com/articles/s41597-019-0247-7" rel="noopener">A public data set of spatio-temporal match events in soccer competitions</a>, Pappalardo L et al, Scientific Data 6(1):236, 2019; Open event data for 1,941 matches in seven men&#x27;s competitions (<a href="https://doi.org/10.1038/s41597-019-0247-7" rel="noopener">DOI</a>)</li>
<li id="src-74"><a href="https://www.nfl.com/playerhealthandsafety/equipment-and-innovation/aws-partnership/building-a-digital-athlete-using-ai-to-rewrite-the-playbook-on-nfl-player-safety" rel="noopener">Building a digital athlete: Using AI to rewrite the playbook on NFL player safety</a>, Langton J, NFL Player Health and Safety, 2024; League article by its senior vice president of health and safety innovation, February 1, 2024</li>
<li id="src-75"><a href="https://nflpaweb.blob.core.windows.net/website/PDFs/CBA/March-15-2020-NFL-NFLPA-Collective-Bargaining-Agreement-Final-Executed-Copy.pdf" rel="noopener">NFL and NFL Players Association Collective Bargaining Agreement, March 15, 2020</a>, National Football League and NFL Players Association, NFL Players Association, 2020; Article 51, Section 14(h) of the agreement, read from the players association copy</li>
<li id="src-76"><a href="https://imgix.cosmicjs.com/25da5eb0-15eb-11ee-b5b3-fbd321202bdf-Final-2023-NBA-Collective-Bargaining-Agreement-6-28-23.pdf" rel="noopener">NBA and National Basketball Players Association Collective Bargaining Agreement, July 2023</a>, National Basketball Association and National Basketball Players Association, National Basketball Players Association, 2023; Article XXII, Section 13 of the agreement, read from the players association copy</li>
<li id="src-77"><a href="https://studentprivacy.ed.gov/sites/default/files/resource_document/file/2019%20HIPAA%20FERPA%20Joint%20Guidance%20508.pdf" rel="noopener">Joint Guidance on the Application of FERPA and HIPAA to Student Health Records (December 2019 Update)</a>, US Department of Health and Human Services and US Department of Education, US Department of Education, Student Privacy Policy Office, 2019; Joint guidance from the Department of Health and Human Services and the Department of Education, December 2019</li>
<li id="src-78"><a href="https://www.fifpro.org/en/articles/2022/09/charter-of-player-data-rights-launched-for-professional-footballers" rel="noopener">Charter of Player Data Rights launched for professional footballers</a>, FIFPRO, FIFPRO, 2022; Announcement of the charter, September 19, 2022, with the union&#x27;s survey of 119 players</li>
<li id="src-79"><a href="https://bjsm.bmj.com/lookup/doi/10.1136/bjsports-2019-101969" rel="noopener">International Olympic Committee consensus statement: methods for recording and reporting of epidemiological data on injury and illness in sport 2020</a>, Bahr R et al, British Journal of Sports Medicine 54(7), 2020; Consensus statement on how to record and report injury and illness data (<a href="https://doi.org/10.1136/bjsports-2019-101969" rel="noopener">DOI</a>)</li>
</ol>
</details>