# Why We Built the SAVRN Data Center Trackers

> Seven public trackers that began as our own working files. It started with a bike ride past gutters full of sprinkler runoff.

Source: https://savrn.com/blog/data-center-trackers
Author: Chad Everett Harris
Published: 2026-09-17

---

The SAVRN data center trackers were never meant to be a product. I built each one because I needed an answer for our own work and could not find it anywhere. However, as the files grew, it became clear that other people needed the same answers. So we published them, because keeping them private helped nobody. Today there are seven public trackers on our site, and as of September 13, 2026 they cite 7,533 outside sources. This post explains why each one exists, since the reasons matter more than the tools. It started with a bike ride.

## Why this matters now

Data centers have become a local argument in almost every state. Water, power, land and taxes are all on the table, and most of the argument runs on numbers nobody has checked. For example, a single figure about Texas water use traveled through dozens of outlets before anyone looked at how it was built. Meanwhile, the people who have to make real decisions need something better than a headline. That includes county commissioners, utility planners and lenders, while it also includes companies like ours.

We build AI factories, so we make those decisions ourselves. Specifically, we need to know where construction is paused, what the water rules are, which grid operator serves a site, and what it demands from a large load. Likewise, we need to know which projects near us have stalled, and why. Because nobody kept that record in one place, we started keeping it. In addition, we decided early that every entry would link to its primary source, since a record nobody can check is just another headline.

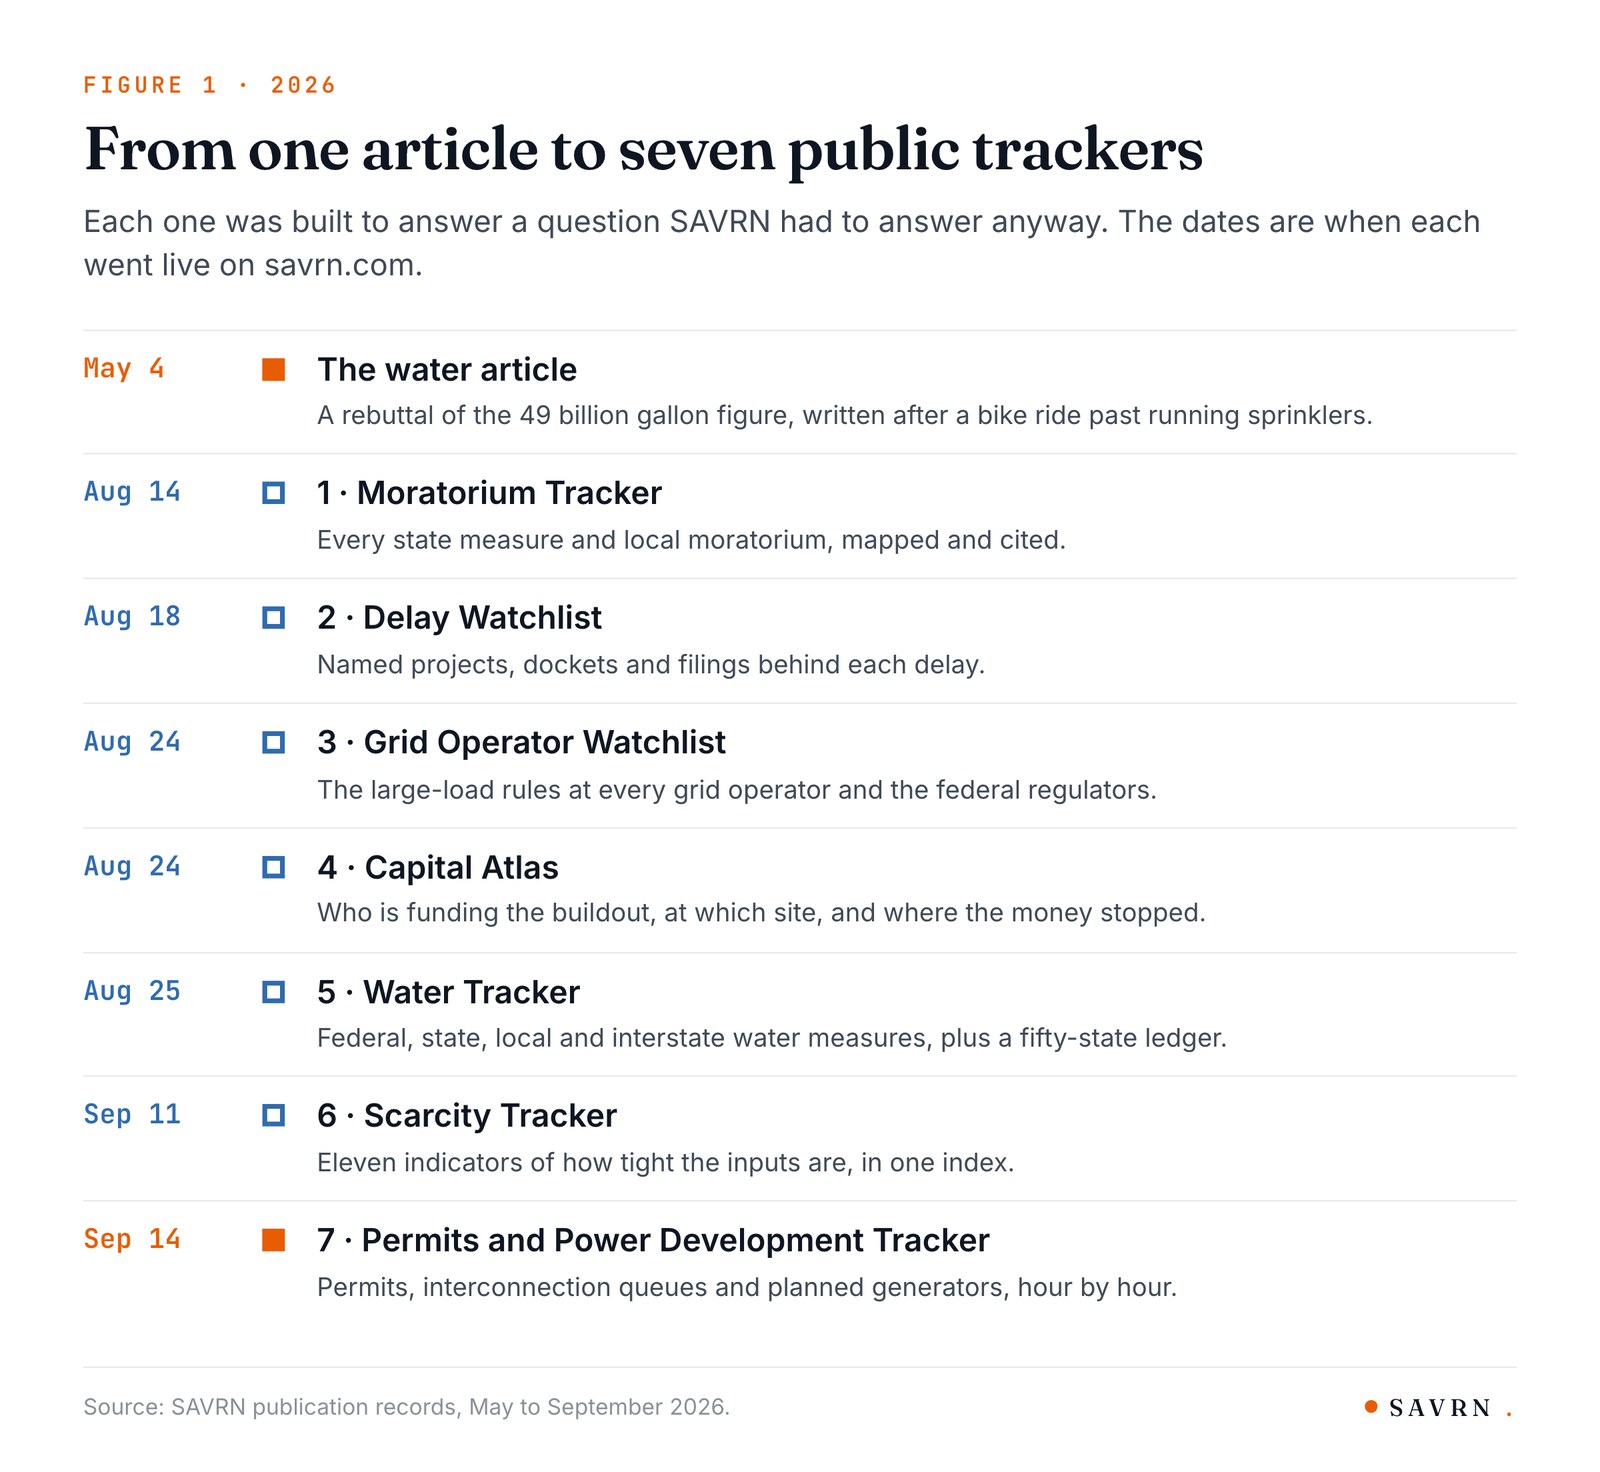
<figure class="bfig"><img src="/media/blog-data-center-trackers-fig1-timeline-20260917b.jpg" alt="Timeline from the May 4 water article to the September 14 permits tracker, seven public trackers in all" loading="lazy"><figcaption>Figure 1. From one article to seven public trackers, with the date each went live.</figcaption></figure>

<div class="statband">
  <div class="stat"><div class="n">7</div><div class="l">public trackers, each built first for SAVRN&#x27;s own use</div><div class="src">SAVRN trackers, September 2026</div></div>
  <div class="stat"><div class="n">7,533</div><div class="l">outside sources cited, as of September 13, 2026</div><div class="src">SAVRN trackers, September 2026</div></div>
  <div class="stat"><div class="n">474 GW</div><div class="l">of large-load requests in Texas, against a 91 GW record peak</div><div class="src">SAVRN trackers, September 2026</div></div>
</div>

<div class="kbox">
  <h3 class="lvl4">What to take from this</h3>
  <ul>
    <li>The trackers began as SAVRN&#x27;s internal working files for siting and building AI factories, and were published once it was clear others needed the same answers.</li>
    <li>It started with one article on Texas data center water use, written after a bike ride past gutters full of sprinkler runoff.</li>
    <li>The 49 billion gallon figure was cut roughly in half by its own authors, and most coverage never caught up.</li>
    <li>Texas has 474 gigawatts of large-load requests against a 91 gigawatt record peak, and regulators now require capital to separate real projects from speculative ones.</li>
    <li>Every entry in every tracker links to its primary source, and nothing is deleted.</li>
  </ul>
</div>

## What happened to the 49 billion gallon figure?

In July 2025, the Austin Chronicle reported a figure from a white paper by the Houston Advanced Research Center. The paper estimated that Texas data centers would consume 49 billion gallons of water in 2025 <sup class="cite"><a href="https://www.austinchronicle.com/news/2025-07-25/texas-is-still-in-drought-and-ai-data-centers-are-quietly-guzzling-up-water/" rel="noopener">1</a></sup>. It also projected 399 billion gallons by 2030, or about 6.6 percent of all water use in the state <sup class="cite"><a href="https://www.austinchronicle.com/news/2025-07-25/texas-is-still-in-drought-and-ai-data-centers-are-quietly-guzzling-up-water/" rel="noopener">1</a></sup>. The number traveled fast, and as a result it became the load-bearing fact in nearly every Texas data center water story for six months.

I had been writing about that figure, although it did not sit right with me. Then one morning I took my bike out. I had just cleaned it, which matters to this story, because the gutters on every street in my neighborhood were running with water. None of it was rain, because it had not rained. Instead, all of it was lawn sprinkler runoff, sheeting across the pavement on its way to the storm drain. That water had been treated, pumped and pressurized, and it was being thrown away before sunrise. I rode home thinking that the public conversation had the wrong villain, since nobody was writing headlines about lawns.

So I did the research and wrote [The 49 Billion Gallon Mirage](/blog/49-billion-gallon-mirage). As it turned out, the authors had already walked the number back. In January 2026, their formal report cut the 2025 figure roughly in half, to a fraction of one percent of Texas water use. However, the revision got a small share of the attention the original had received, and most of the stories that carried the first number never caught up. Since then, researchers at the University of Texas have published their own estimate, which projects data centers at 3 to 9 percent of state water use by 2040 <sup class="cite"><a href="https://compass.beg.utexas.edu/files/publications/Water_Requirements_for_DC_White_Paper.pdf" rel="noopener">2</a></sup>. That is a serious number, and therefore it deserves a serious record beside it.

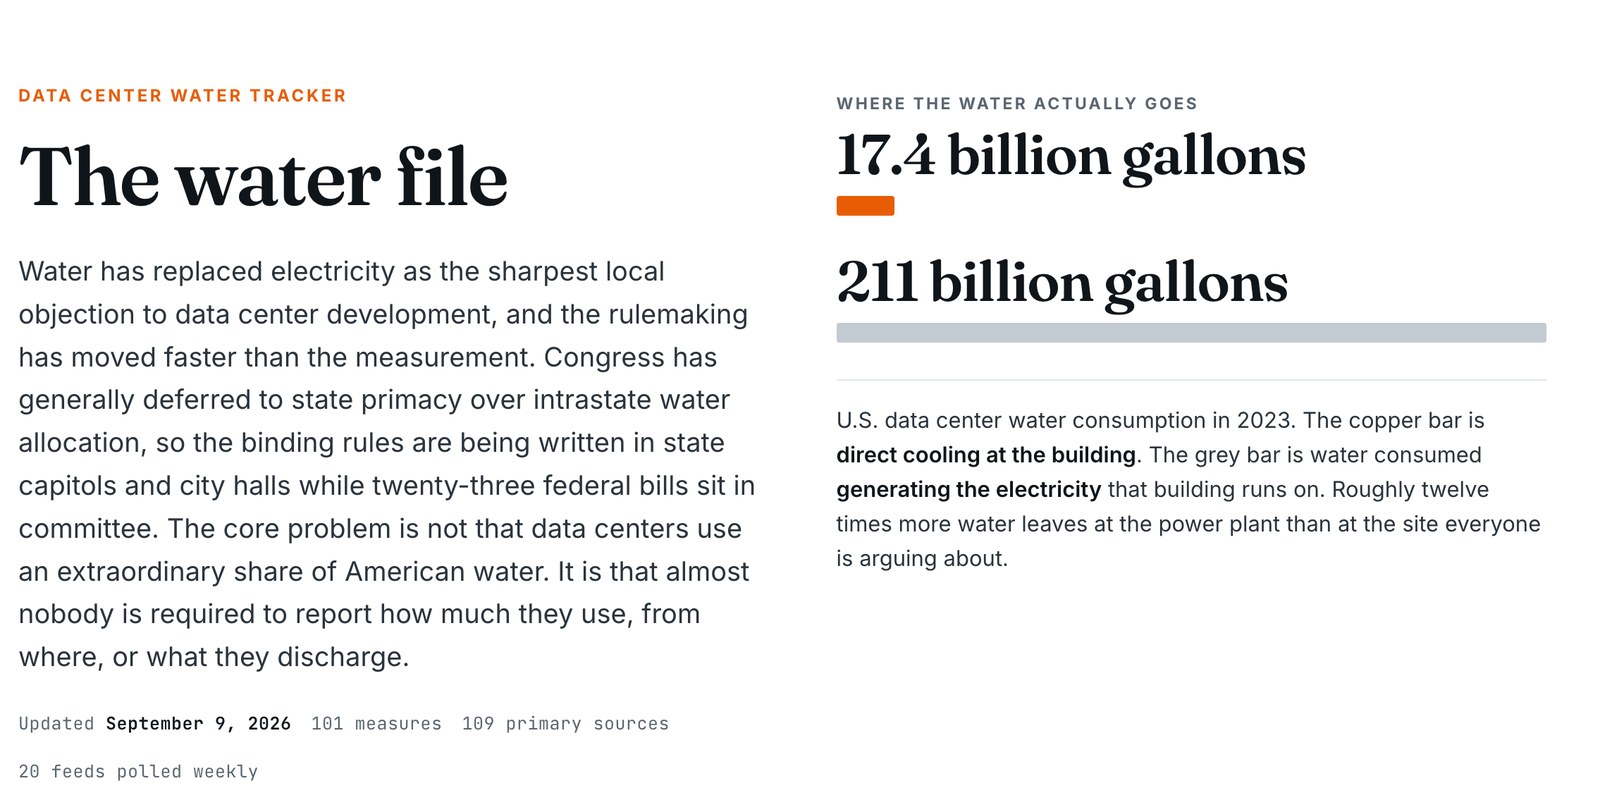
<figure class="bfig"><img src="/media/blog-data-center-trackers-shot-water-20260917.jpg" alt="The Data Center Water Tracker page: 101 measures, 109 primary sources, direct cooling beside power generation water" loading="lazy"><figcaption>The Water Tracker, which began as the evidence file behind one article.</figcaption></figure>

That is what the [Data Center Water Tracker](/data-center-water-tracker) became. It holds 101 water measures at the federal, state, local and interstate level, drawn from 109 primary sources. Its central finding is simple, although it surprises people. The problem is rarely that data centers use an extraordinary share of water. Rather, almost nobody is required to report how much they use, from where, or what they discharge.

## Why did one article become a set of trackers?

After the water article, I started noticing the moratoriums. First it was a county here and a township there. Then, instead of townships, it was state legislatures. By the summer of 2026 the pattern was national, and nobody was keeping a complete, cited list.

Around the same time I came across a crowdsourced map of community concerns about data centers, published under Erin Brockovich's name. Snopes confirmed that the project is hers <sup class="cite"><a href="https://www.snopes.com/fact-check/erin-brockovich-data-center-maps/" rel="noopener">3</a></sup>. The entries come from the public, and the map reports thousands of them across all fifty states. I understand why people submit them, because nobody else was listening. Nevertheless, a pin on a map is a concern, and a concern is a different thing from a record. My reaction was that somebody needed to put out documents that are factual, sourced and checkable, so that the concern and the record could be read side by side. Accordingly, our Water Tracker notes that map's totals as reported by the platform, and keeps them out of the ledger.

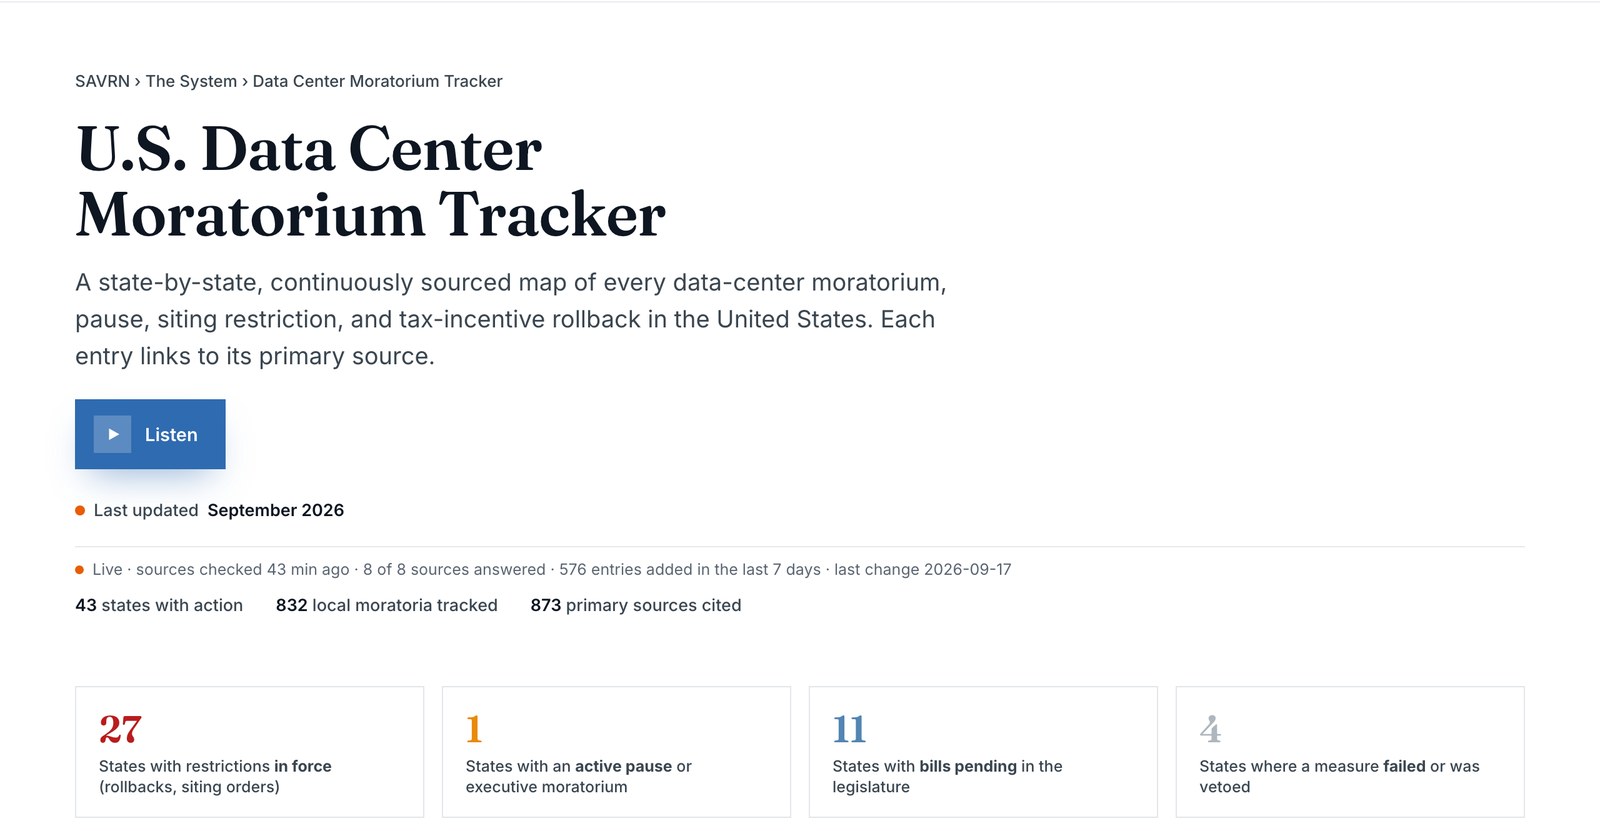
<figure class="bfig"><img src="/media/blog-data-center-trackers-shot-moratorium-20260917.jpg" alt="The Moratorium Tracker page: 43 states with action, 832 local moratoria, 873 primary sources cited" loading="lazy"><figcaption>The Moratorium Tracker: every state measure and local moratorium, each linked to its source.</figcaption></figure>

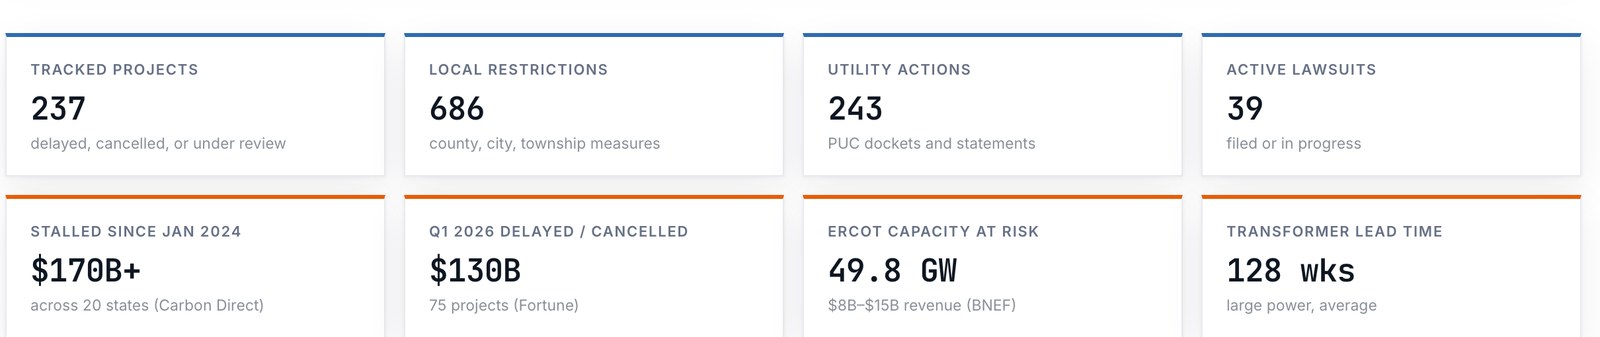
So we built the [Data Center Moratorium Tracker](/data-center-moratorium-tracker). Today it shows 43 states with action and 832 local moratoria, backed by 873 primary sources. Specifically, 27 states have restrictions in force, one has an active pause, and 11 have bills pending. Next came the [Delay Watchlist](/data-center-delay-tracker), which follows 237 projects that are delayed, cancelled or under review. Specifically, it ties each one to the docket, lawsuit or filing behind the delay.

<figure class="bfig"><img src="/media/blog-data-center-trackers-shot-delay-20260917.jpg" alt="Delay Watchlist tiles: 237 tracked projects, 686 local restrictions, 243 utility actions, 39 active lawsuits" loading="lazy"><figcaption>The Delay Watchlist ties each stalled project to the docket, lawsuit or filing behind it.</figcaption></figure>

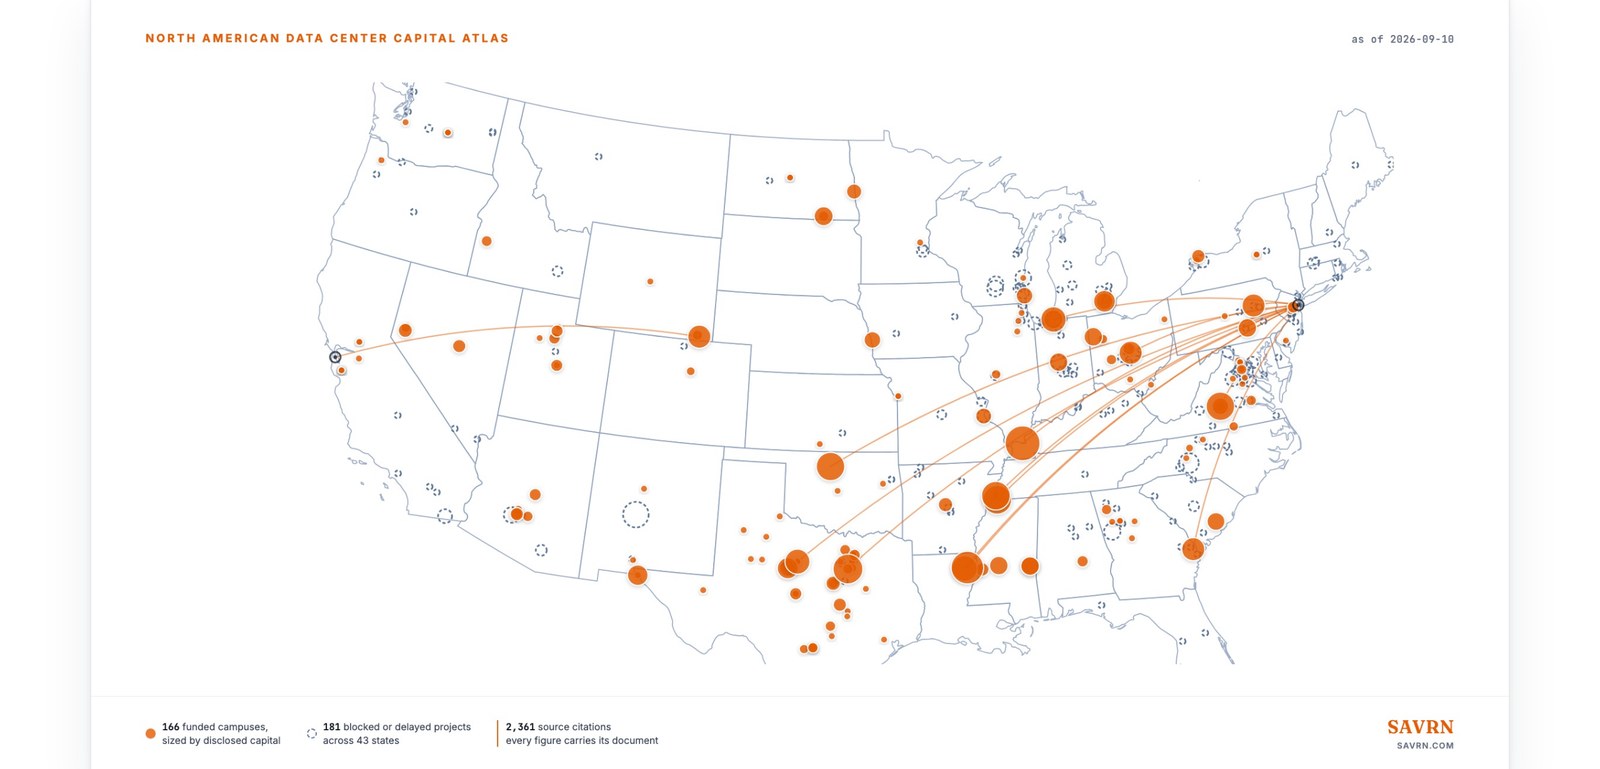
Then the question became who was paying for all of it, and how much of that money had stopped. As a result, we built the [Capital Atlas](/data-center-capital-atlas). It records 98 capital providers, 201 named sites and 318 financing transactions, drawn from 2,534 source citations.

<figure class="bfig"><img src="/media/blog-data-center-trackers-shot-atlas-20260917.jpg" alt="Capital Atlas map of North America with funded campuses in copper and blocked or delayed projects outlined" loading="lazy"><figcaption>The Capital Atlas: where the money went, and where it stopped.</figcaption></figure>

## How much of the power queue is real?

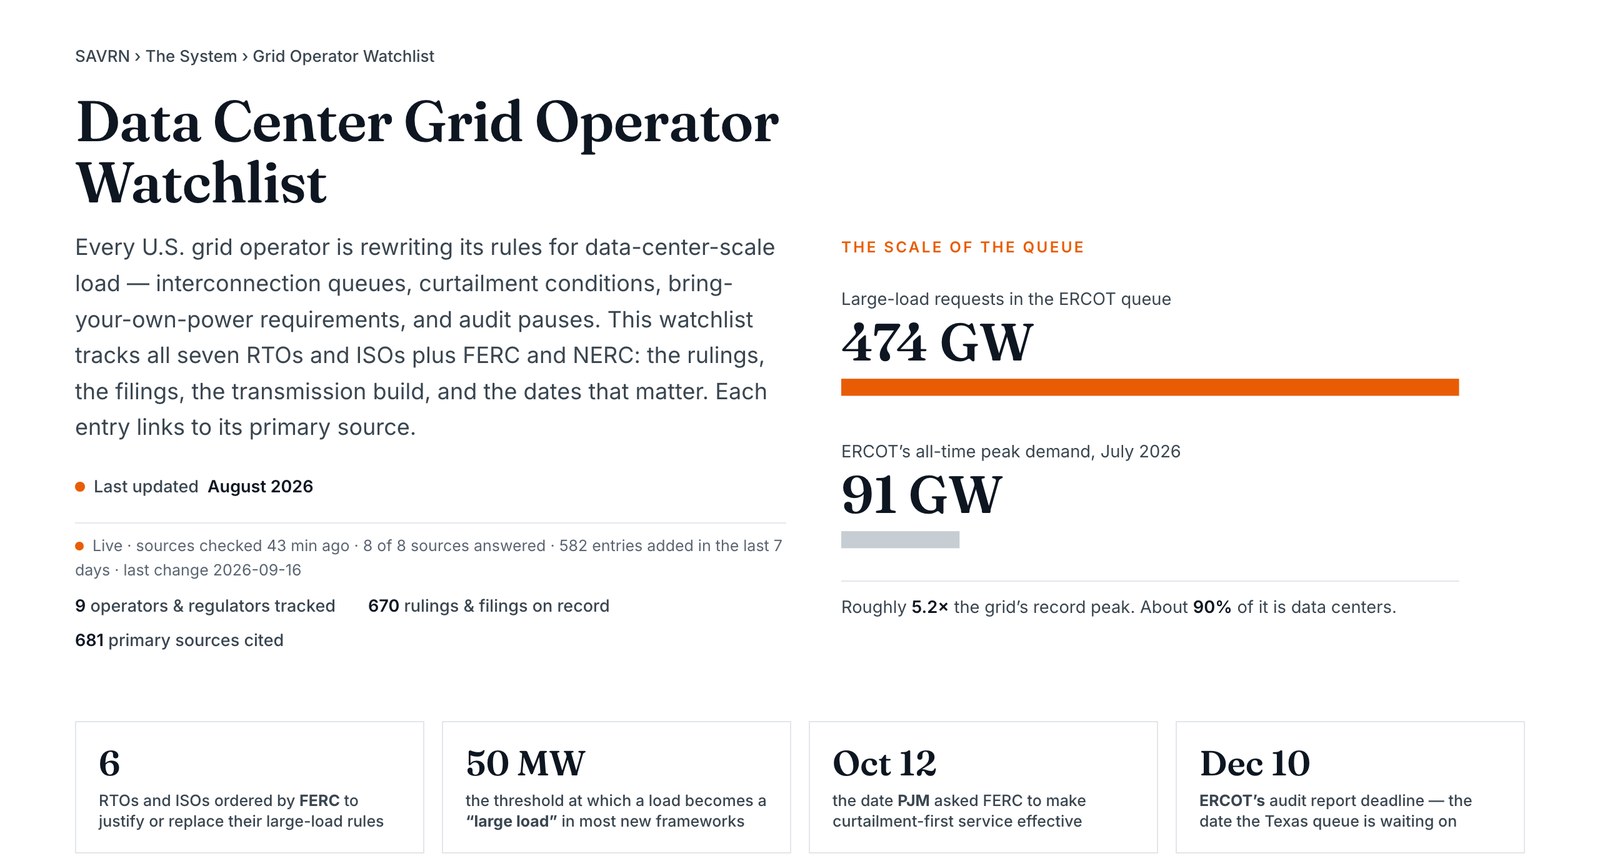
Power is the one that stuck with me most, because the numbers are so large. If you have spent time around electrical infrastructure, the quantities being requested in Texas stop you cold. Large-load requests in the ERCOT queue stand at 474 gigawatts. By comparison, the grid's all-time peak demand, set in July 2026, is 91 gigawatts. In other words, the queue is about five times the largest load the Texas grid has ever served, and about 90 percent of it is data centers.

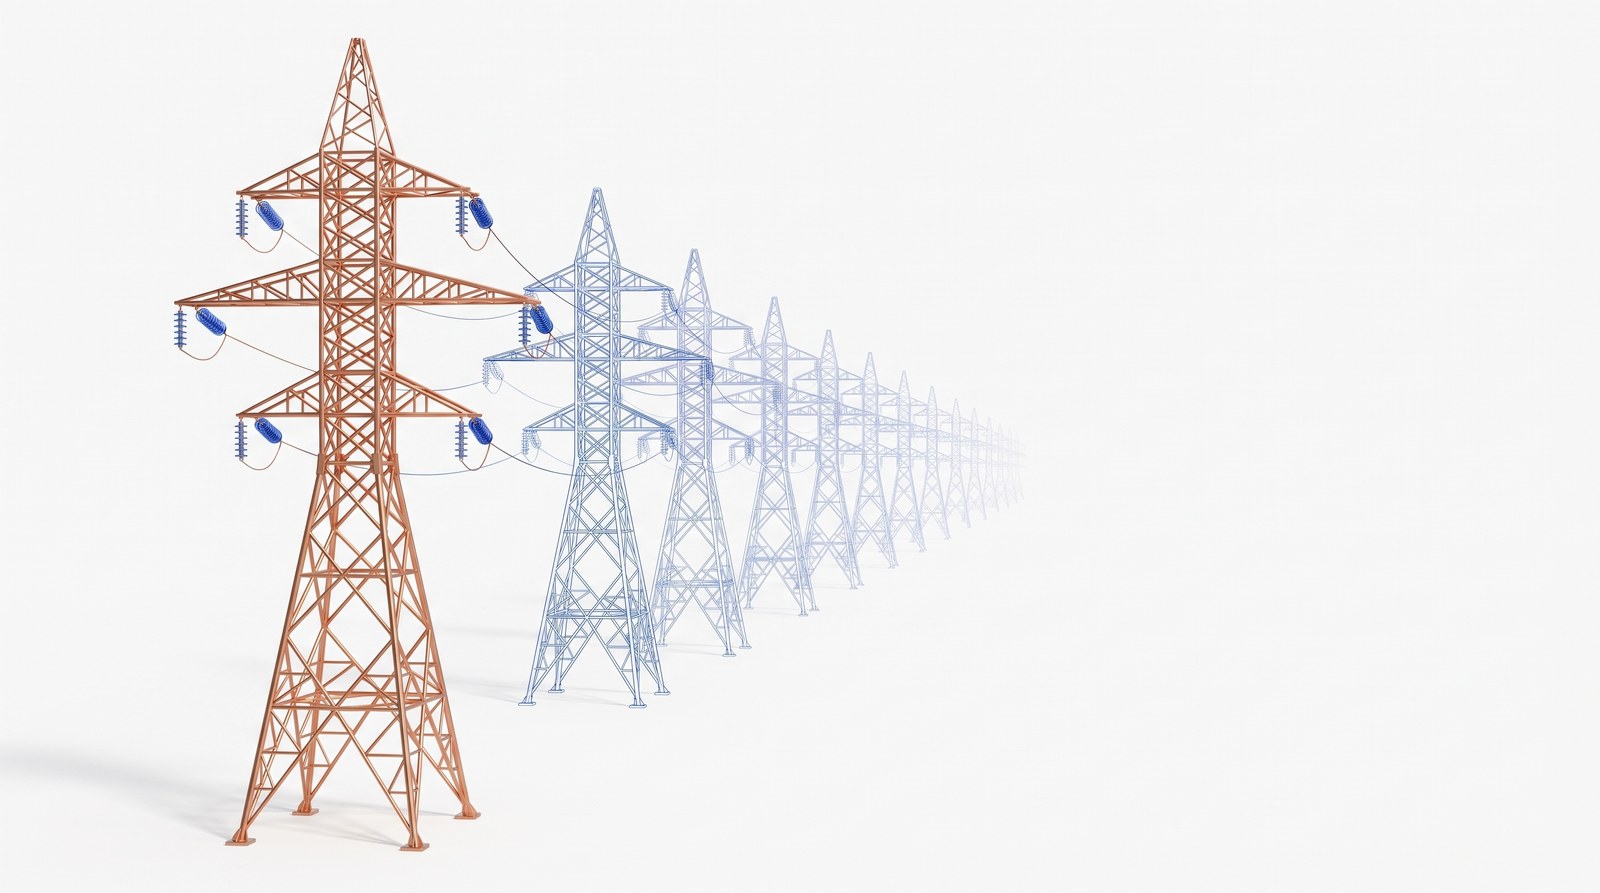
<figure class="bfig"><img src="/media/blog-data-center-trackers-art-towers-20260917.jpg" alt="One copper transmission tower in front of a long row of blueprint-outline towers fading into the distance" loading="lazy"><figcaption>One tower is built. The rest are requests.</figcaption></figure>

Nobody who builds things believes all of that is real, since steel and transformers do not exist in those quantities. A developer can file the same project with several utilities, because a place in line is cheap and a late start is expensive. Consequently, the queue measures ambition more than it measures construction. However, the interesting part is that the regulators knew it, and they were already fixing it.

Texas Senate Bill 6 took effect in June 2025. It applies to loads of 75 megawatts and above, sets a flat study fee of at least $100,000, and requires a large load to disclose whether it is requesting a substantially similar interconnection elsewhere in Texas <sup class="cite"><a href="https://www.mcguirewoods.com/client-resources/alerts/2025/7/texas-senate-bill-6-significantly-expands-regulatory-oversight-over-large-loads-in-ercot/" rel="noopener">4</a></sup>. Furthermore, the Public Utility Commission's proposed standards go further. They would set study fees of $100,000 and $300,000 by project size, and they would require $50,000 per megawatt of requested load as financial security <sup class="cite"><a href="https://www.gtlaw.com/en/insights/2026/3/texas-senate-bill-6-update-what-data-centers-large-load-customers-should-know-about-proposed-interconnection-standards" rel="noopener">5</a></sup>. Put simply, if you want to be studied, you post capital. That is how you find out which gigawatts are real, because a speculative request will not post the money.

<figure class="bfig"><img src="/media/blog-data-center-trackers-shot-grid-20260917.jpg" alt="Grid Operator Watchlist page: 474 GW of large-load requests in the ERCOT queue against a 91 GW record peak" loading="lazy"><figcaption>The Grid Operator Watchlist opens with the scale of the Texas queue against the grid&#x27;s record peak.</figcaption></figure>

The same thing is happening across the country. Therefore the [Grid Operator Watchlist](/data-center-grid-operator-watchlist) follows all seven regional grid operators plus the federal regulators. Specifically, it holds 670 rulings and filings from 681 primary sources. It also records that federal regulators have ordered six of those operators to justify or replace their large-load rules. For anyone siting a campus, this is the file that decides whether a site can energize.

## Why do permits tie it all together?

By September I had water, moratoriums, delays, capital and grid rules, and they kept pointing at each other. A moratorium delays a project. A delayed project, in turn, strands capital, while the lender waits. A grid rule decides whether the project was ever going to get power. However, one layer was missing, which was the physical one. Policy says what may be built, whereas a permit says what is being built.

That thought went furthest on the power side, because power is the long pole. If a data center needs new generation, then the power plant's permit, its place in the interconnection queue, and its reported construction date say more about the future than any press release. As a result, we built the [Permits and Power Development Tracker](/data-center-permits-tracker). It follows building permits for data centers and substations, large-load and power plant requests in the grid operators' queues, planned generators reported to the federal energy agency, reactor projects, and registered facilities. Today it holds 10,717 records from 19 public sources, and it updates every hour. We wrote about it in more detail in [the permit tracker post](/blog/data-center-permit-tracker).

Finally, one more tracker completes the seven. The [Scarcity Tracker](/ai-index/scarcity-tracker) scores eleven indicators of how tight the inputs are, from vacancy to turbine lead times, and rolls them into one index. Today it reads in the Scarce range. Two companions sit beside the seven, although neither is a tracker. The [U.S. Data Center Map](/data-center-map) names 4,761 data centers from primary sources, against 4,767 listed commercially, and ties each state to the trackers above. Similarly, the [SAVRN Index](/ai-index) does for prices what the trackers do for policy. It follows 732 prices from 54 providers and keeps every change, which we described in [the Index post](/blog/savrn-index).

## What do the seven trackers hold today?

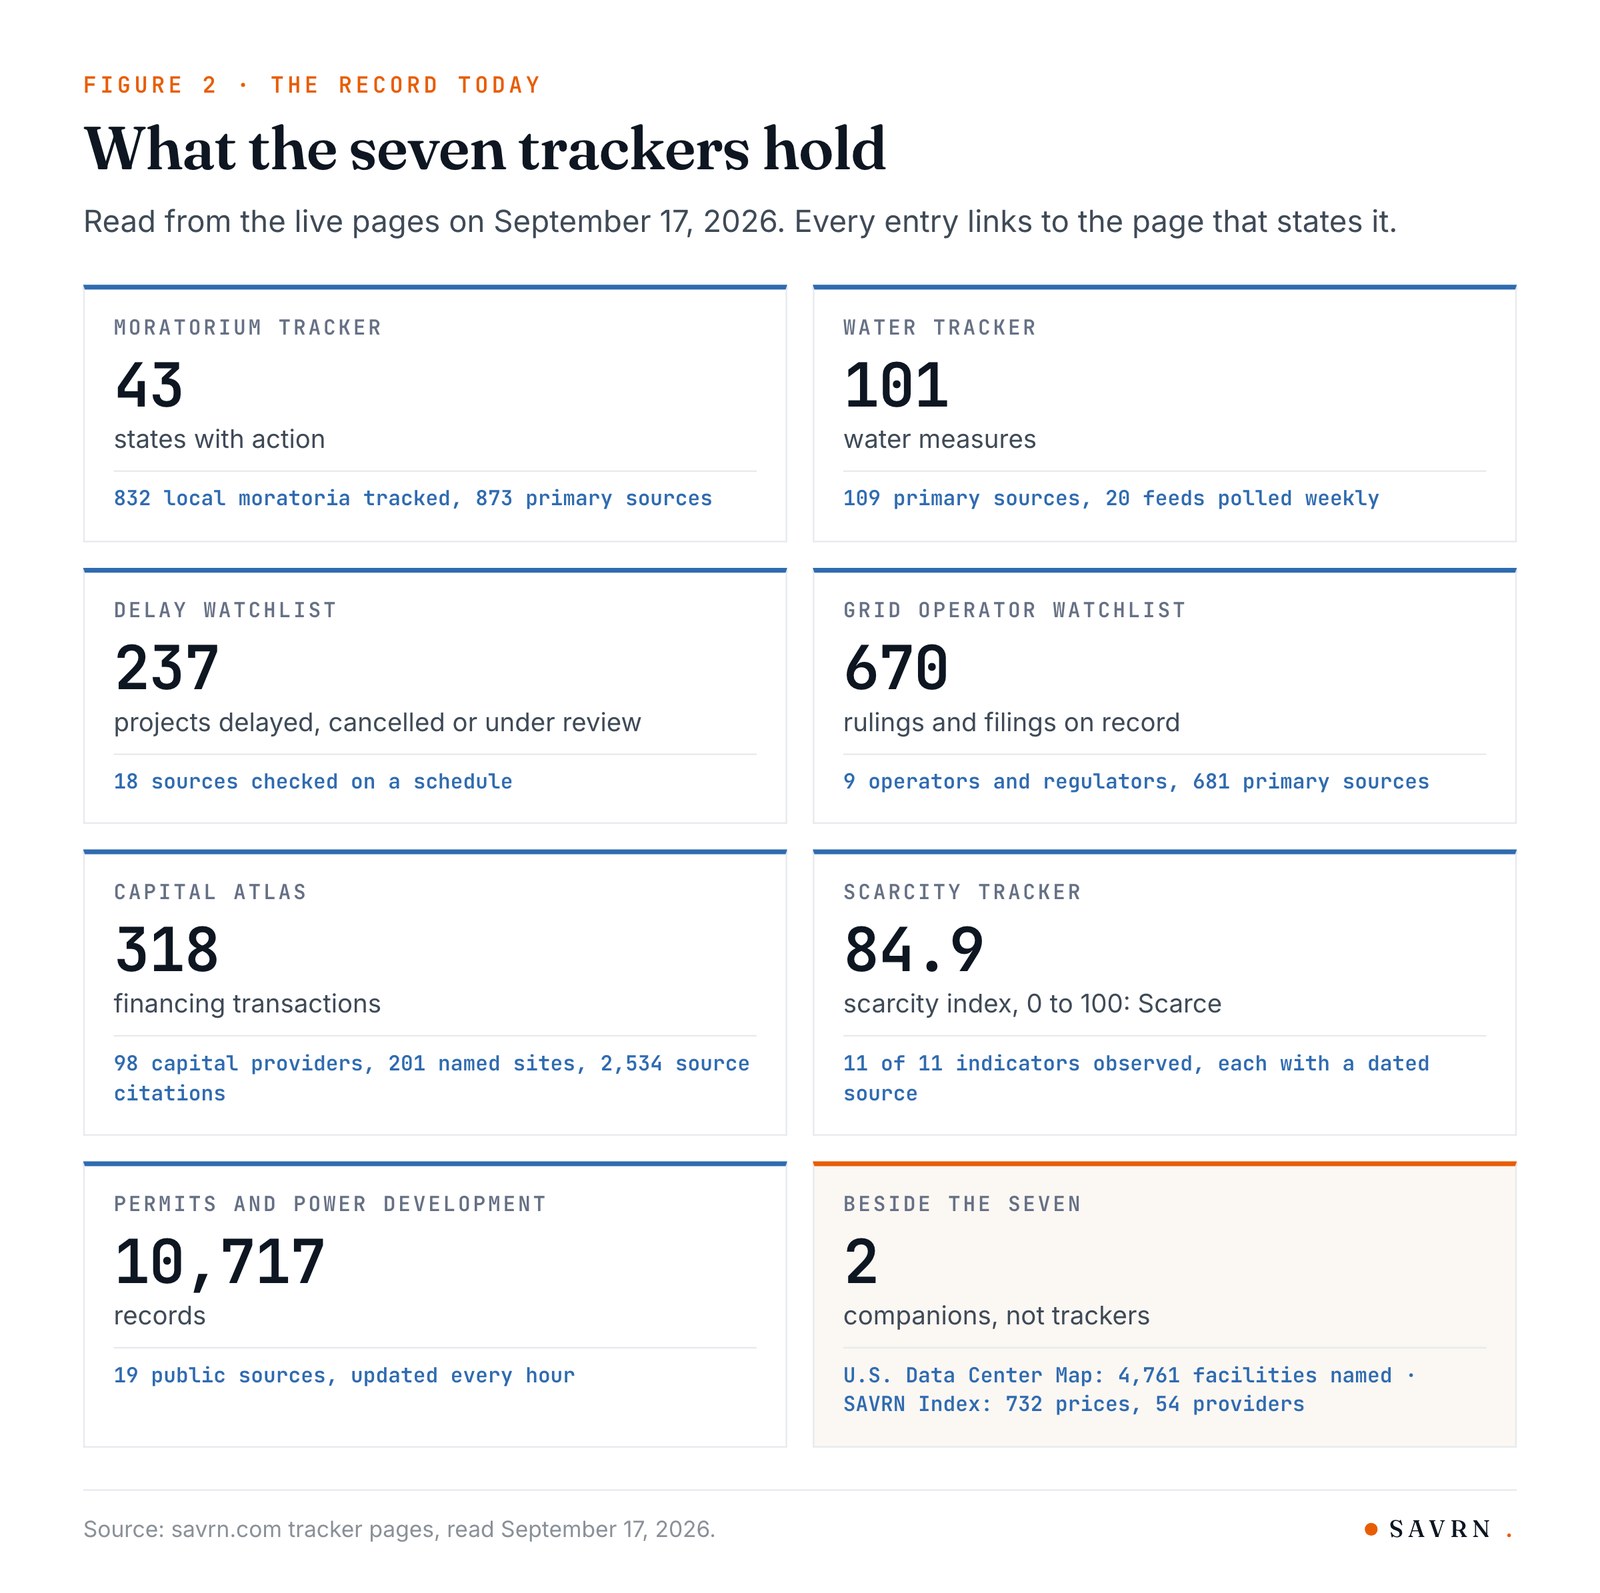
<figure class="bfig"><img src="/media/blog-data-center-trackers-fig2-what-they-hold-20260917b.jpg" alt="Seven cards with each SAVRN tracker and its headline count, plus the map and the price index beside them" loading="lazy"><figcaption>Figure 2. What the seven trackers hold, read from the live pages on September 17, 2026.</figcaption></figure>

Each one began as a working file, because we needed it for our own decisions. Notably, none of them began as a plan to publish. The Moratorium Tracker started as a list of places we should not waste time on. Similarly, the Water Tracker started as the evidence file behind one article. Likewise, the Grid Operator Watchlist started as my notes on which utilities wanted capital up front. The Delay Watchlist and the Capital Atlas started as a way to read our own market, while the scarcity file started as a way to price it. The permits file started as a hunch that generation permits predict everything downstream.

What they share, however, is a method. First, every entry links to the page that states it, whether that is a bill, a docket, a filing or an agency dataset. Second, the pages are checked on a schedule by software we run ourselves, and each page shows when its sources were last checked. Third, nothing is deleted, because a measure that failed is as informative as one that passed. In addition, claims we cannot verify are recorded as claims, with the name of whoever made them.

## Why publish work built for internal use?

The plain answer is that the work turned out to be worth more shared than kept. We were maintaining the files anyway, because our own work depended on them. Meanwhile, the people on the other side of our conversations kept asking the same questions we had asked. A county official wanted to know what neighboring counties had passed. Similarly, a lender wanted to know which projects near a site had stalled. A university wanted to know what its grid operator now requires. Because the answers already existed in our files, handing them over was the obvious thing to do.

There is also a less comfortable reason. Our industry has not earned much trust, and part of that is our own doing. Companies announce numbers that flatter them, opponents repeat numbers that alarm people, and neither side shows its work. Therefore the most useful thing a builder can do is publish a record that anyone can check, including the parts that are inconvenient for builders. The trackers list moratoriums that passed, projects that died, and water rules that will cost operators money. That is the point of them, because a record that flatters its author is not a record.

## How SAVRN builds for this

SAVRN builds and operates AI factories that communities are proud to host. Each campus generates its own power on site, runs water-free cooling, and places a training institute at the front of the campus to reskill the local workforce. Those choices came from the same files described above. Specifically, the water record is why we chose cooling that does not draw on local supply. Similarly, the grid record is why we bring our own generation instead of joining a queue that is five times the size of the grid. The moratorium and delay records tell us where a community has already said no, and we take that answer seriously.

We also hold our own claims to the trackers' standard. For instance, the [SAVRN Index](/ai-index) measures our offering in the same table, against the same principles, as every other company's. If a number of ours cannot be sourced, then it does not go on the page, because the rule applies to us first.

## What to do next

1. If you are weighing a site, start with the [Moratorium Tracker](/data-center-moratorium-tracker) and the [Water Tracker](/data-center-water-tracker) for that state, then read the [Grid Operator Watchlist](/data-center-grid-operator-watchlist) entry for the operator that serves it.
2. If you are lending or investing, read the [Delay Watchlist](/data-center-delay-tracker) and the [Capital Atlas](/data-center-capital-atlas) together, since one shows where money went and the other shows where it stopped.
3. If you are a local official, open your state's page and compare what neighboring jurisdictions have passed, with the text of each measure one click away.
4. If you plan power, use the [Permits and Power Development Tracker](/data-center-permits-tracker) to see which generators and large loads are actually moving.
5. If you find an error, tell us. Several pages carry a correction link, and the [contact page](/contact) works for all of them, because a corrected record is the whole idea.

## Frequently asked questions

### What are the SAVRN data center trackers?
They are seven public trackers on the SAVRN website, and specifically they follow data center moratoriums, water rules, project delays, grid operator rules, capital, permits and scarcity. A facility map and a price index sit beside them. Every entry links to its primary source.

### Why did SAVRN build the trackers?
Each one began as an internal working file, because siting and building AI factories raises these questions every day. We published them because other people kept asking the same questions, and the answers already existed in our files.

### What started the project?
It started with an article about a claim that Texas data centers would use 49 billion gallons of water in 2025. As a result, the research behind that article became the evidence file that grew into the Water Tracker.

### Was the 49 billion gallon figure wrong?
Its own authors revised it, although few people noticed. In January 2026 the Houston Advanced Research Center cut the 2025 estimate roughly in half. However, most coverage that carried the original number was never updated.

### How large is the Texas power queue?
Large-load requests in the ERCOT queue stand at 474 gigawatts, against an all-time peak demand of 91 gigawatts in July 2026. Notably, about 90 percent of the requests are data centers.

### How are regulators separating real projects from speculative ones?
They are requiring capital, because a speculative project rarely posts it. For example, Texas Senate Bill 6 sets a study fee of at least $100,000 and requires disclosure of duplicate requests. In addition, proposed state standards would require $50,000 per megawatt as financial security.

### How often are the trackers updated?
It depends on the tracker, since each source moves at its own pace. The permits tracker updates every hour, the price Index checks every three hours, and the policy trackers are checked on a schedule shown at the top of each page.

### Where does the data come from?
It comes from primary sources: bills, agency dockets, securities filings, grid operator queues, federal datasets and company disclosures. As of September 13, 2026, the references cited 7,533 outside sources.

### Does SAVRN include information that is bad for data center builders?
Yes. The trackers list moratoriums that passed, projects that were cancelled, and water rules that raise operating costs. A record that left those out would not be worth checking, because readers would see the gap.

### Can I correct an entry?
Yes. Several tracker pages carry a correction link, and any entry can be reported through the contact page. Entries are then updated, specifically when a primary source shows the record is wrong or out of date.

<details class="bsrc" markdown="1">
<summary>Sources</summary>

1. [Texas Is Still in Drought, and AI Data Centers Are Quietly Guzzling Up Water](https://www.austinchronicle.com/news/2025-07-25/texas-is-still-in-drought-and-ai-data-centers-are-quietly-guzzling-up-water/), The Austin Chronicle, Jul 25, 2025.
2. [Water Requirements for Data Centers, white paper](https://compass.beg.utexas.edu/files/publications/Water_Requirements_for_DC_White_Paper.pdf), Bureau of Economic Geology, The University of Texas at Austin, May 2026.
3. [Erin Brockovich data center maps, fact check](https://www.snopes.com/fact-check/erin-brockovich-data-center-maps/), Snopes, 2026.
4. [Texas Senate Bill 6 Significantly Expands Regulatory Oversight Over Large Loads in ERCOT](https://www.mcguirewoods.com/client-resources/alerts/2025/7/texas-senate-bill-6-significantly-expands-regulatory-oversight-over-large-loads-in-ercot/), McGuireWoods, Jul 2025.
5. [Texas Senate Bill 6 Update: Proposed Interconnection Standards](https://www.gtlaw.com/en/insights/2026/3/texas-senate-bill-6-update-what-data-centers-large-load-customers-should-know-about-proposed-interconnection-standards), Greenberg Traurig, Mar 2026.
6. SAVRN tracker pages and publication records, read September 17, 2026. Counts for each reference are as shown on its live page; the source count is as of September 13, 2026.

</details>