# Are 200 Neoclouds About to Collapse? Our Price Data Says Something Else

> After Musk's warning about 200+ neoclouds, our tracked GPU prices went up, not down. The shakeout is about pricing and operating DNA, not demand.

Source: https://savrn.com/blog/are-200-neoclouds-about-to-collapse
Author: Chad Everett Harris
Published: 2026-10-26

---

Are 200 neoclouds about to collapse? That question took over the AI infrastructure debate on October 25. That day, Elon Musk posted that SpaceX had closed $40 billion of debt for GPUs, and that it could do so because it is investment grade and has Starlink and launch revenue. He also wrote that debt markets "have almost entirely shut off access to money for any company that doesn't have substantial revenue independent of AI data centers," and that "200+ neoclouds are going to see guppy-level death and consolidation."<sup class="cite"><a href="https://siliconangle.com/2026/10/25/elon-musk-predicts-neocloud-shakeout-as-credit-for-ai-infrastructure-dries-up/" rel="noopener" title="SiliconANGLE: Elon Musk predicts neocloud shakeout as credit for AI infrastructure dries up, October 25, 2026">1</a></sup> Within a day, the coverage turned to who would be eaten first.

Most of those takes assume the same thing. Specifically, they assume the neoclouds will die because AI compute is turning into a commodity and prices are falling. However, that is not what our data shows.

We have spent most of this year building the SAVRN Index, and since September 11 it has checked GPU cloud prices every day.<sup class="cite"><a href="https://savrn.com/ai-index/pricing/history" rel="noopener" title="SAVRN Index: Price history and methodology">2</a></sup> Over that stretch, prices went up, not down. In fact, the sellers in trouble are not the ones charging too much. Rather, they are the ones still selling AI capacity the way a bitcoin miner sells a coin: as cheaply as possible, to whoever will take it.

This article lays out what our prices, leases and contracts show. It also explains why I think the real dividing line in this market is operating DNA.

<div class="btab"><div class="btab-cap"><b>Key figures</b> The numbers behind this article, with sources</div><div class="brows"><div class="br"><span class="br-k">GPU cloud list-price index, Sep 11 to Oct 26</span><span class="br-v">+6.1%</span><span class="br-b">SAVRN Index, 117 same-item list prices <sup class="cite"><a href="https://savrn.com/ai-index/pricing/history" rel="noopener" title="SAVRN Index: Price history and methodology">2</a></sup></span></div><div class="br"><span class="br-k">GPU prices that rose vs. fell, same period</span><span class="br-v">43 vs. 3</span><span class="br-b">182 prices incl. spot and reserved <sup class="cite"><a href="https://savrn.com/ai-index/pricing/history" rel="noopener" title="SAVRN Index price database: daily GPU price checks, September 11 to October 26, 2026">3</a></sup></span></div><div class="br"><span class="br-k">Verda H100 on-demand, per GPU-hour</span><span class="br-v">$3.25 → $4.56</span><span class="br-b">+40% in six weeks <sup class="cite"><a href="https://savrn.com/ai-index/pricing/history" rel="noopener" title="SAVRN Index price database: daily GPU price checks, September 11 to October 26, 2026">3</a></sup></span></div><div class="br"><span class="br-k">H100 standard on-demand range</span><span class="br-v">$1.99–$12.29</span><span class="br-b">31 offers, median $4.09 <sup class="cite"><a href="https://savrn.com/ai-index/pricing/history" rel="noopener" title="SAVRN Index price database: daily GPU price checks, September 11 to October 26, 2026">3</a></sup></span></div><div class="br"><span class="br-k">Shell lease rent, AI labs</span><span class="br-v">~$198/kW-mo</span><span class="br-b">median of 3 leases <sup class="cite"><a href="https://savrn.com/ai-index/pricing/wholesale" rel="noopener" title="SAVRN Index: Wholesale and landlord pricing">4</a></sup></span></div><div class="br"><span class="br-k">Shell lease rent, hyperscalers and big tech</span><span class="br-v">~$139/kW-mo</span><span class="br-b">median of 9 leases <sup class="cite"><a href="https://savrn.com/ai-index/pricing/wholesale" rel="noopener" title="SAVRN Index: Wholesale and landlord pricing">4</a></sup></span></div><div class="br"><span class="br-k">Rent to recover $9,500/kW at 14% capital</span><span class="br-v">$128.89/kW-mo</span><span class="br-b">SAVRN calculation, 15-year case <sup class="cite"><a href="https://savrn.com/blog/twenty-cents-to-twenty-five-dollars" rel="noopener" title="SAVRN: Twenty Cents to Twenty-Five Dollars">5</a></sup></span></div><div class="br"><span class="br-k">Nebius Q2 deals, prepayment cover of capex</span><span class="br-v">50–60%</span><span class="br-b">on about 70% of deals <sup class="cite"><a href="https://www.sec.gov/Archives/edgar/data/1513845/000110465926094568/tm2622968d1_ex99-2.htm" rel="noopener" title="Nebius Group: Q2 2026 shareholder letter (SEC exhibit 99.2)">6</a></sup></span></div><div class="br"><span class="br-k">CoreWeave Q2 2026 net loss</span><span class="br-v">$626M</span><span class="br-b">on $2.575B of revenue <sup class="cite"><a href="https://www.sec.gov/Archives/edgar/data/1769628/000176962826000366/R4.htm" rel="noopener" title="CoreWeave: Q2 2026 Form 10-Q, income statement">7</a></sup></span></div><div class="br"><span class="br-k">Neocloud providers Gartner expects to lose independence by 2030</span><span class="br-v">>80%</span><span class="br-b">Gartner, Oct 14, 2026 <sup class="cite"><a href="https://www.gartner.com/en/newsroom/press-releases/2026-10-14-gartner-says-over-us-dollars-three-and-a-half-trillion-of-artificial-intelligence-infrastructure-spending-could-be-exposed-to-impairment-by-the-end-of-2030" rel="noopener" title="Gartner: Over $3.5 trillion of AI infrastructure spending could be exposed to impairment by 2030, October 14, 2026">8</a></sup></span></div></div></div>

## What Musk actually said

Musk's post was about credit, not demand. He did not say people stopped wanting AI compute. Rather, he said lenders now separate borrowers who have other revenue from borrowers whose whole repayment story is AI data centers.<sup class="cite"><a href="https://siliconangle.com/2026/10/25/elon-musk-predicts-neocloud-shakeout-as-credit-for-ai-infrastructure-dries-up/" rel="noopener" title="SiliconANGLE: Elon Musk predicts neocloud shakeout as credit for AI infrastructure dries up, October 25, 2026">1</a></sup>

That distinction matters. A lender financing SpaceX can look past the GPUs to Starlink and launch cash flows. By contrast, a lender financing a pure-play neocloud is underwriting one thing: whether the contracts on those GPUs will pay back the debt before the hardware ages out.

Two cautions apply, however. First, "200+ neoclouds" is Musk's count, not a census. Second, "almost entirely shut off" is a claim from a company that just raised money, not a full measure of the credit market. Even so, the mechanism he describes is real, and it points straight at pricing. If your contracts do not cover your cost of capital, a lender will see it before you do.

## Our prices went up, not down

The SAVRN Index tracks 229 GPU prices from 27 providers across 10 GPU types.<sup class="cite"><a href="https://savrn.com/ai-index/pricing/gpus" rel="noopener" title="SAVRN Index: GPU cloud pricing">9</a></sup> In addition, across all four markets we follow, it holds 797 prices from 55 providers.<sup class="cite"><a href="https://savrn.com/ai-index/pricing" rel="noopener" title="SAVRN Index: Pricing">10</a></sup> For the GPU cloud market, we publish a same-item index of list prices. Because only items priced on both days count, a new product launch or an expiring discount cannot move it.<sup class="cite"><a href="https://savrn.com/ai-index/pricing/history" rel="noopener" title="SAVRN Index: Price history and methodology">2</a></sup>

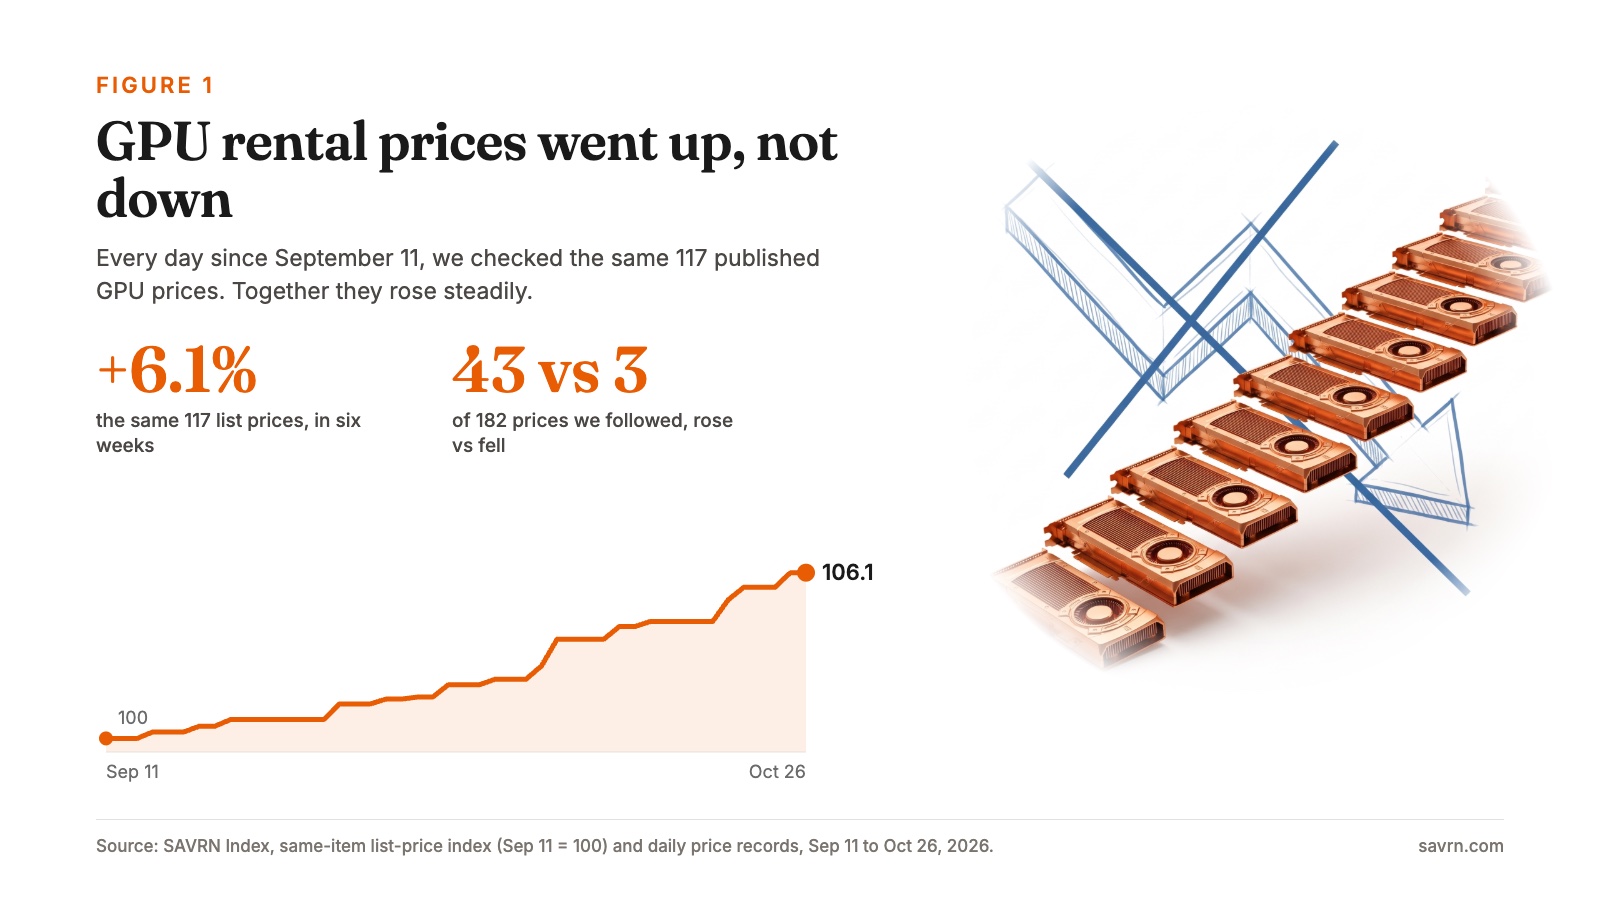
Since September 11, that index has risen 6.1%.<sup class="cite"><a href="https://savrn.com/ai-index/pricing/history" rel="noopener" title="SAVRN Index: Price history and methodology">2</a></sup>

<figure class="bfig"><img src="/media/blog-neocloud-pricing-index-v2-20261026.jpg" alt="Copper staircase of GPU cards beside a chart of GPU rental prices rising 6.1% in six weeks" width="1600" height="900" loading="lazy"><figcaption><b>Figure 1.</b> The same 117 published GPU prices, checked every day since September 11, rose 6.1%. Only prices checked on both days count, so launches and expiring discounts cannot move the index. Chart: SAVRN.</figcaption></figure>

Looking wider, we also followed every GPU price we could from mid-September through late October, including spot, serverless and reserved prices. Of 182 such prices, 43 rose while only 3 fell.<sup class="cite"><a href="https://savrn.com/ai-index/pricing/history" rel="noopener" title="SAVRN Index price database: daily GPU price checks, September 11 to October 26, 2026">3</a></sup>

The increases were not random. In particular, short-term and flexible prices moved first: spot, serverless, capacity blocks and monthly reservations. By contrast, one-year and three-year reserved prices did not move. That pattern is what you would expect if buyers who need capacity now are bidding for it.

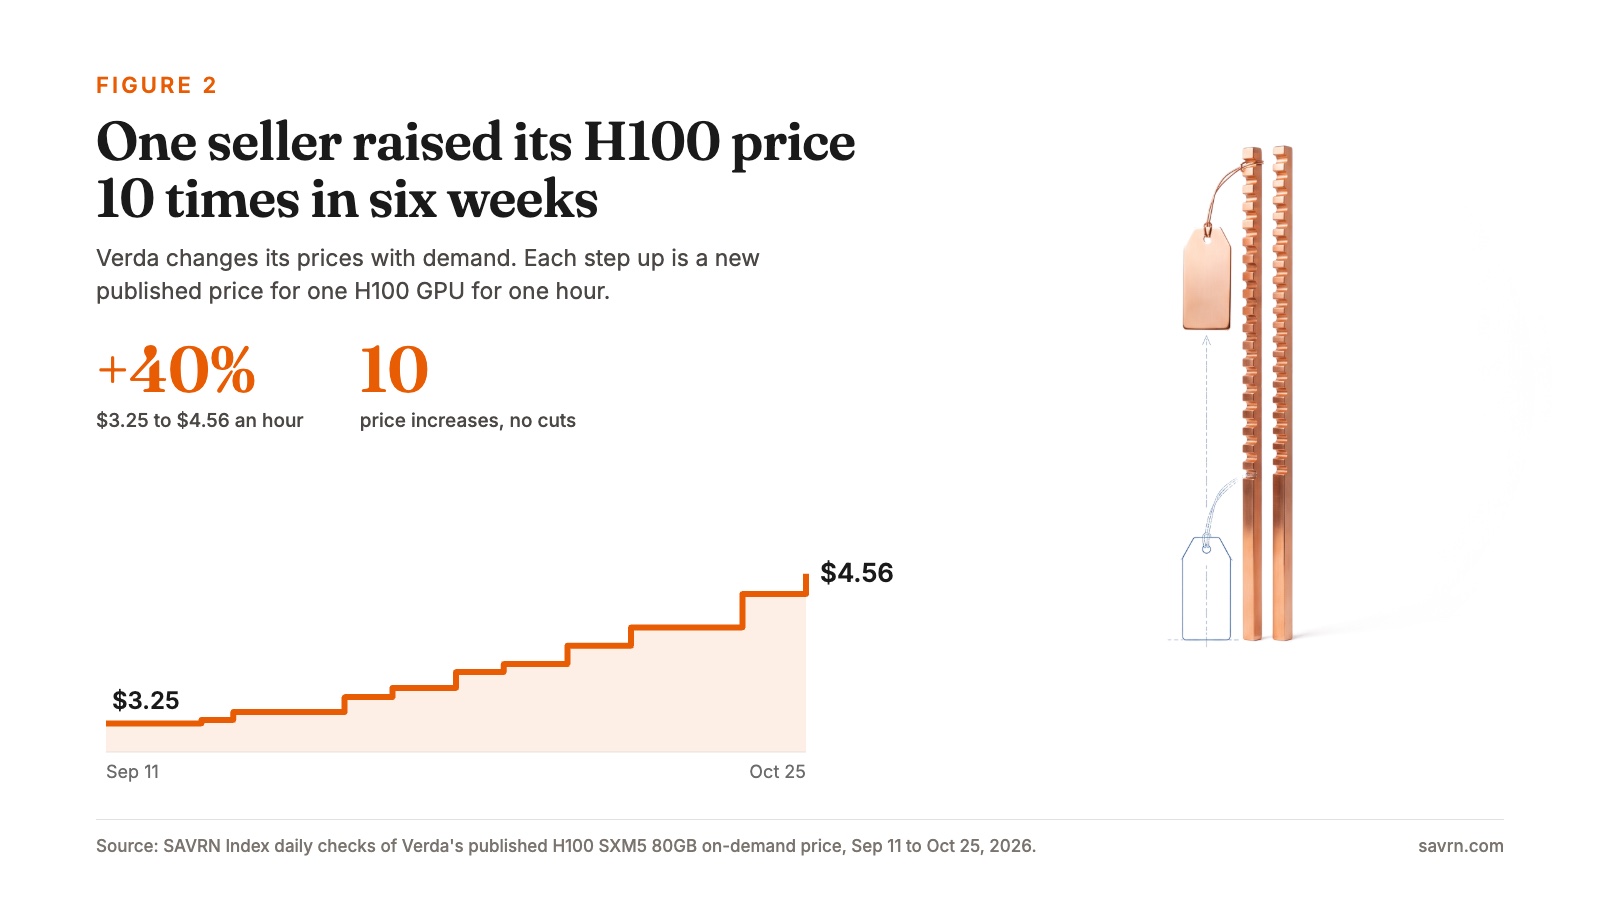
One seller makes the point clearly, since Verda reprices its GPUs every few days. Its H100 on-demand price rose from $3.25 an hour on September 11 to $4.56 on October 25, an increase of 40%.<sup class="cite"><a href="https://savrn.com/ai-index/pricing/history" rel="noopener" title="SAVRN Index price database: daily GPU price checks, September 11 to October 26, 2026">3</a></sup> In fact, all 23 of the Verda prices we track went up.

<figure class="bfig"><img src="/media/blog-neocloud-pricing-verda-v2-20261026.jpg" alt="Copper price tag on a ratchet beside a step chart of an H100 price rising from $3.25 to $4.56" width="1600" height="900" loading="lazy"><figcaption><b>Figure 2.</b> Verda's published H100 on-demand price stepped up ten times in six weeks, with no cuts. Chart: SAVRN.</figcaption></figure>

Others moved too, although less sharply. For example, Runpod's tracked prices rose a median of about 14%. AWS capacity blocks rose a median of 7.5%, while individual Nebius and Crusoe prices rose 20% and 15%.<sup class="cite"><a href="https://savrn.com/ai-index/pricing/history" rel="noopener" title="SAVRN Index price database: daily GPU price checks, September 11 to October 26, 2026">3</a></sup> Meanwhile, Azure, Google, CoreWeave and Lambda left their tracked prices unchanged.

Six weeks is a short record, and I want to be plain about that. Our list prices do not show discounts, utilization or what any provider actually collects. Still, they are enough to reject the story that GPU prices are collapsing. Outside data points the same way. For example, SemiAnalysis reported that one-year H100 rental contract prices rose almost 40%, from $1.70 an hour in October 2025 to $2.35 by March 2026.<sup class="cite"><a href="https://newsletter.semianalysis.com/p/the-great-gpu-shortage-rental-capacity" rel="noopener" title="SemiAnalysis: The Great GPU Shortage, Rental Capacity, April 2, 2026">11</a></sup>

## The same H100, from $1.99 to $12.29

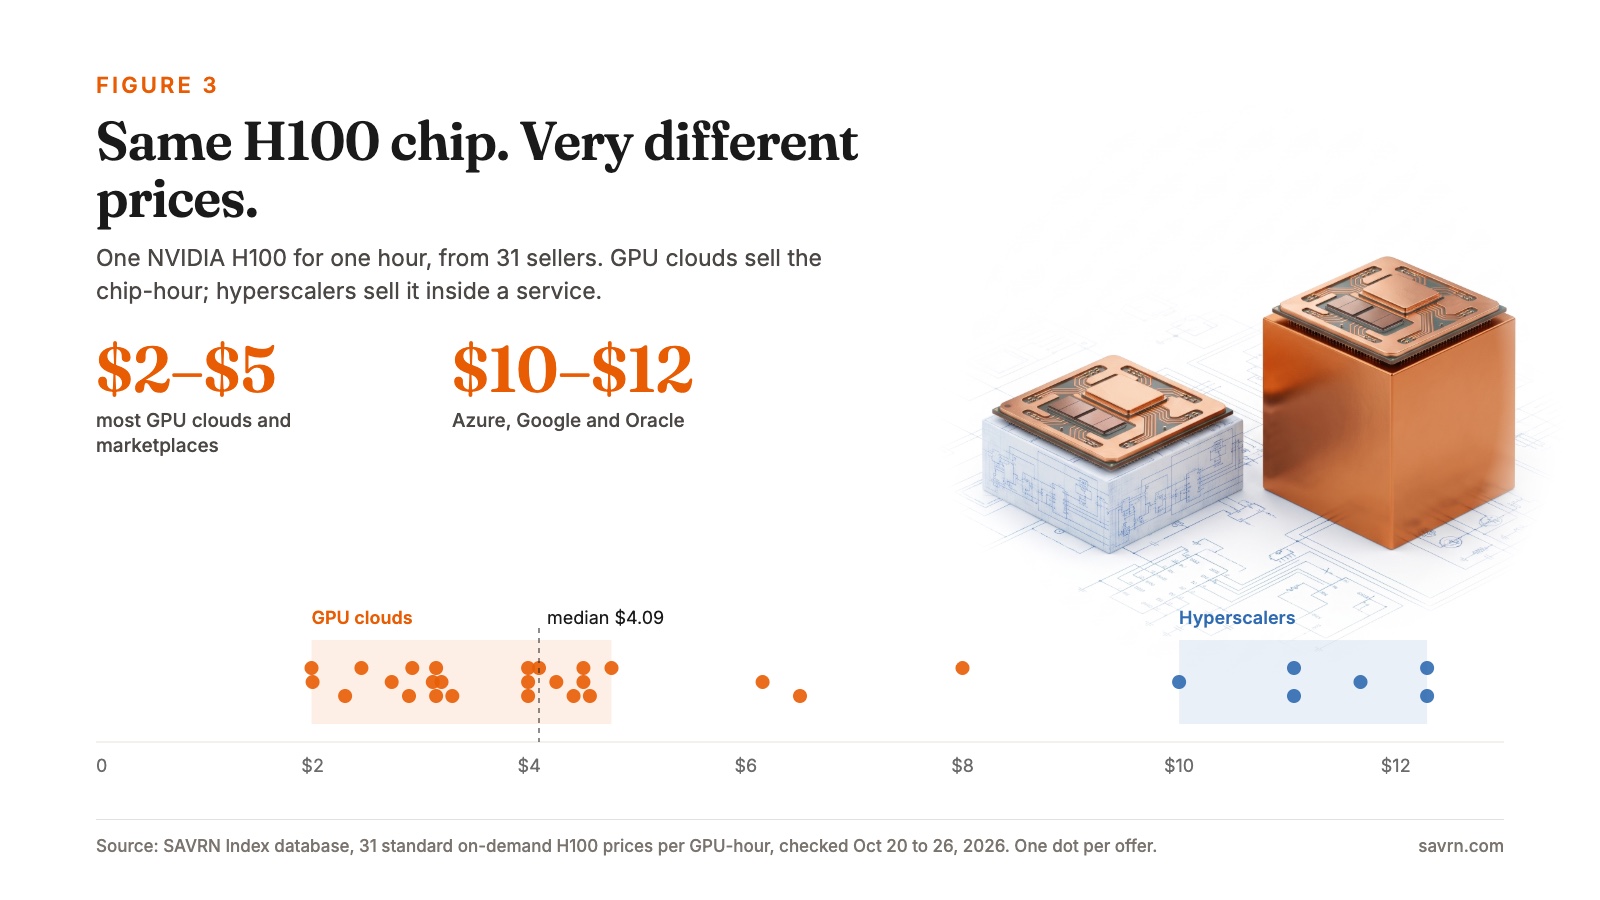
Here is the number that made me rethink this market. Our latest check found 31 standard on-demand prices for an NVIDIA H100.<sup class="cite"><a href="https://savrn.com/ai-index/pricing/history" rel="noopener" title="SAVRN Index price database: daily GPU price checks, September 11 to October 26, 2026">3</a></sup> The cheapest was $1.99 an hour, while the most expensive was $12.29. The median was $4.09. Our GPU page, which also counts calendar-mode and serverless rates, shows 38 on-demand prices with a typical price of $4.35.<sup class="cite"><a href="https://savrn.com/ai-index/pricing/gpus" rel="noopener" title="SAVRN Index: GPU cloud pricing">9</a></sup>

<figure class="bfig"><img src="/media/blog-neocloud-pricing-h100-v2-20261026.jpg" alt="Two identical copper H100 chips on low and tall pedestals beside a chart of 31 H100 prices" width="1600" height="900" loading="lazy"><figcaption><b>Figure 3.</b> Same chip, same week: 31 standard on-demand offers. Most GPU clouds charge $2 to $5 an hour; Azure, Google and Oracle list $10 to $12.29. Chart: SAVRN.</figcaption></figure>

The cluster at the low end is GPU clouds and marketplaces, mostly between $2 and $4.76. By contrast, the cluster at the top is the hyperscalers. Oracle lists $10.00, while Google ($11.06 to $11.68) and Azure ($11.06 to $12.29) list standard on-demand rates.<sup class="cite"><a href="https://savrn.com/ai-index/pricing/gpus" rel="noopener" title="SAVRN Index: GPU cloud pricing">9</a></sup> Google's calendar-mode rate is lower, at $5.20 to $5.50.<sup class="cite"><a href="https://savrn.com/ai-index/pricing/gpus" rel="noopener" title="SAVRN Index: GPU cloud pricing">9</a></sup>

It is the same chip. Yet the hyperscalers' standard rates run about 2.5 to 2.7 times the typical price, because they are not selling a chip-hour. Instead, they are selling a place inside an account the customer already trusts, with security, support and everything else attached. Meanwhile, much of the neocloud market is selling the chip-hour alone, and competing on price.

Because of that, the gap is where I think the shakeout will happen.

## Miner DNA

Many neoclouds and AI landlords started as bitcoin miners. That history gave them real skills: finding power, building fast and running hardware hard. However, it also gave them an operating system built for a very different product.

A bitcoin miner is a price taker, because every coin is the same and the network sets the price. For instance, the U.S. Energy Information Administration identifies electricity as miners' main operating cost.<sup class="cite"><a href="https://www.eia.gov/todayinenergy/detail.php?id=61364" rel="noopener" title="U.S. EIA: Today in Energy, cryptocurrency mining electricity use">12</a></sup> Similarly, Cambridge's electricity model assumes miners run only the hardware that is profitable at a given power price, adjusted for cooling overhead.<sup class="cite"><a href="https://ccaf.io/cbnsi/cbeci/methodology" rel="noopener" title="Cambridge Centre for Alternative Finance: CBECI methodology">13</a></sup> As a result, the winning miner is the one with the cheapest power, the cheapest building and the most hours of uptime.

Over time, those habits become the company. They decide which executives get promoted, what engineers optimize, which sites get bought and what the board celebrates. Consequently, a team built around dollars per megawatt-hour, dollars per megawatt built and machine uptime will carry those same scorecards into AI unless it changes them on purpose.

Crusoe shows both sides of that inheritance. It was founded in 2018 to mine bitcoin with natural gas that would otherwise have been flared at oil fields. It deployed more than 425 modular data centers, then in March 2025 agreed to sell its bitcoin business to NYDIG to focus on AI.<sup class="cite"><a href="https://cointelegraph.com/news/crusoe-to-sell-bitcoin-mining-business-nydig-to-focus-on-ai" rel="noopener" title="Cointelegraph: Crusoe to sell bitcoin mining business to NYDIG to focus on AI, March 25, 2025">14</a></sup> That history built real skill in energy, modular construction and remote operations. Then the company changed what it sells.

The market noticed. In September 2026, Crusoe raised $3.9 billion at a post-money valuation of $30.9 billion.<sup class="cite"><a href="https://www.zawya.com/en/special-coverage/ai-infrastructure-provider-crusoe-valued-at-30.9bln-in-latest-funding-round-982627" rel="noopener" title="Reuters via Zawya: AI infrastructure provider Crusoe valued at $30.9 billion in latest funding round, September 18, 2026">15</a></sup> That is slightly more than CoreWeave's market value at its October 22 close, about $30.7 billion based on its last reported share count.<sup class="cite"><a href="https://www.nasdaq.com/market-activity/stocks/crwv/historical" rel="noopener" title="Nasdaq: CoreWeave (CRWV) historical prices">16</a></sup> A private round and a public share price are not the same thing. Still, in our view, investors are paying for a former miner that changed what it sells, not for one that mines cheaper.

In short, the problem is not where these companies came from. Rather, it is carrying a price taker's rules into a market where the seller can set the price.

<div class="btab"><div class="btab-cap"><b>Table 1</b> Miner defaults and what an AI business needs instead</div><div class="brows"><div class="br"><span class="br-k">Find the cheapest power first</span><span class="br-v">Workload first</span><span class="br-b">Start with the customer's workload and delivery date, then optimize power within that design.</span></div><div class="br"><span class="br-k">Minimize shell and fit-out cost</span><span class="br-v">Build for goodput</span><span class="br-b">AI needs liquid cooling, networking, redundancy and serviceability, not the lowest first cost.</span></div><div class="br"><span class="br-k">Maximize machine running time</span><span class="br-v">Cash per GPU</span><span class="br-b">Utilization bought with discounts can sink capital recovery.</span></div><div class="br"><span class="br-k">Treat output as interchangeable</span><span class="br-v">Sell outcomes</span><span class="br-b">GPU-hours differ in performance, reliability, location, control and support.</span></div><div class="br"><span class="br-k">Keep the customer team small</span><span class="br-v">Build the front office</span><span class="br-b">AI contracts need solutions design, onboarding, support, credit and renewals.</span></div><div class="br"><span class="br-k">Reward megawatts deployed</span><span class="br-v">Reward returns</span><span class="br-b">Pay for realized price, payback, return on capital, delivery and renewals.</span></div></div></div>

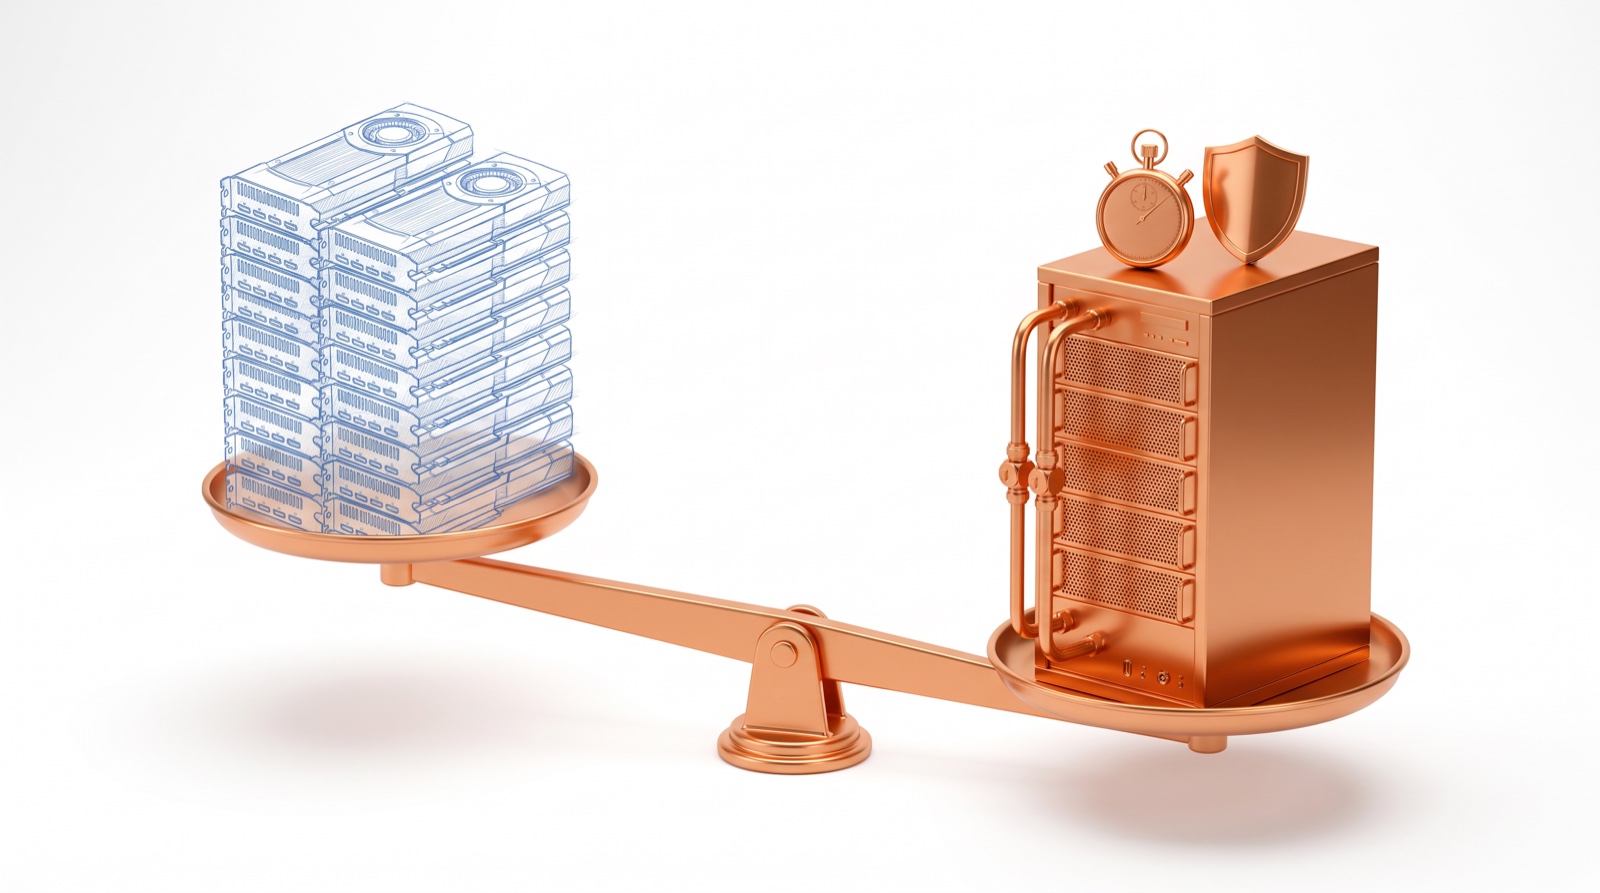
<figure class="bfig"><img src="/media/blog-neocloud-pricing-balance-20261026.jpg" alt="Copper AI server rack on a balance scale outweighing a tall stack of blueprint GPU cards" width="1600" height="893" loading="lazy"><figcaption><b>Figure 4.</b> Buyers pay for what the GPU delivers: time to compute, reliability and control. A pile of identical chip-hours weighs less than it looks. Illustration: SAVRN.</figcaption></figure>

## What the miners got right

None of this means the miners' skills are worthless. In fact, power is the scarcest input in AI infrastructure, and miners learned to find it before anyone else was looking. They learned to build on remote land, negotiate with utilities, run hardware at high load and move fast.

Those skills still matter, because a buyer cannot use capacity that does not exist. For that reason, the miner who already holds a powered site has a real head start over a newcomer waiting years for a grid connection.

The real question is what those skills serve. Cheap power is an input advantage, not a product. Therefore, the strongest operators will use cheap power and fast construction to fund reliability, performance and returns, rather than to justify selling the cheapest hour.

## Rent tells the same story

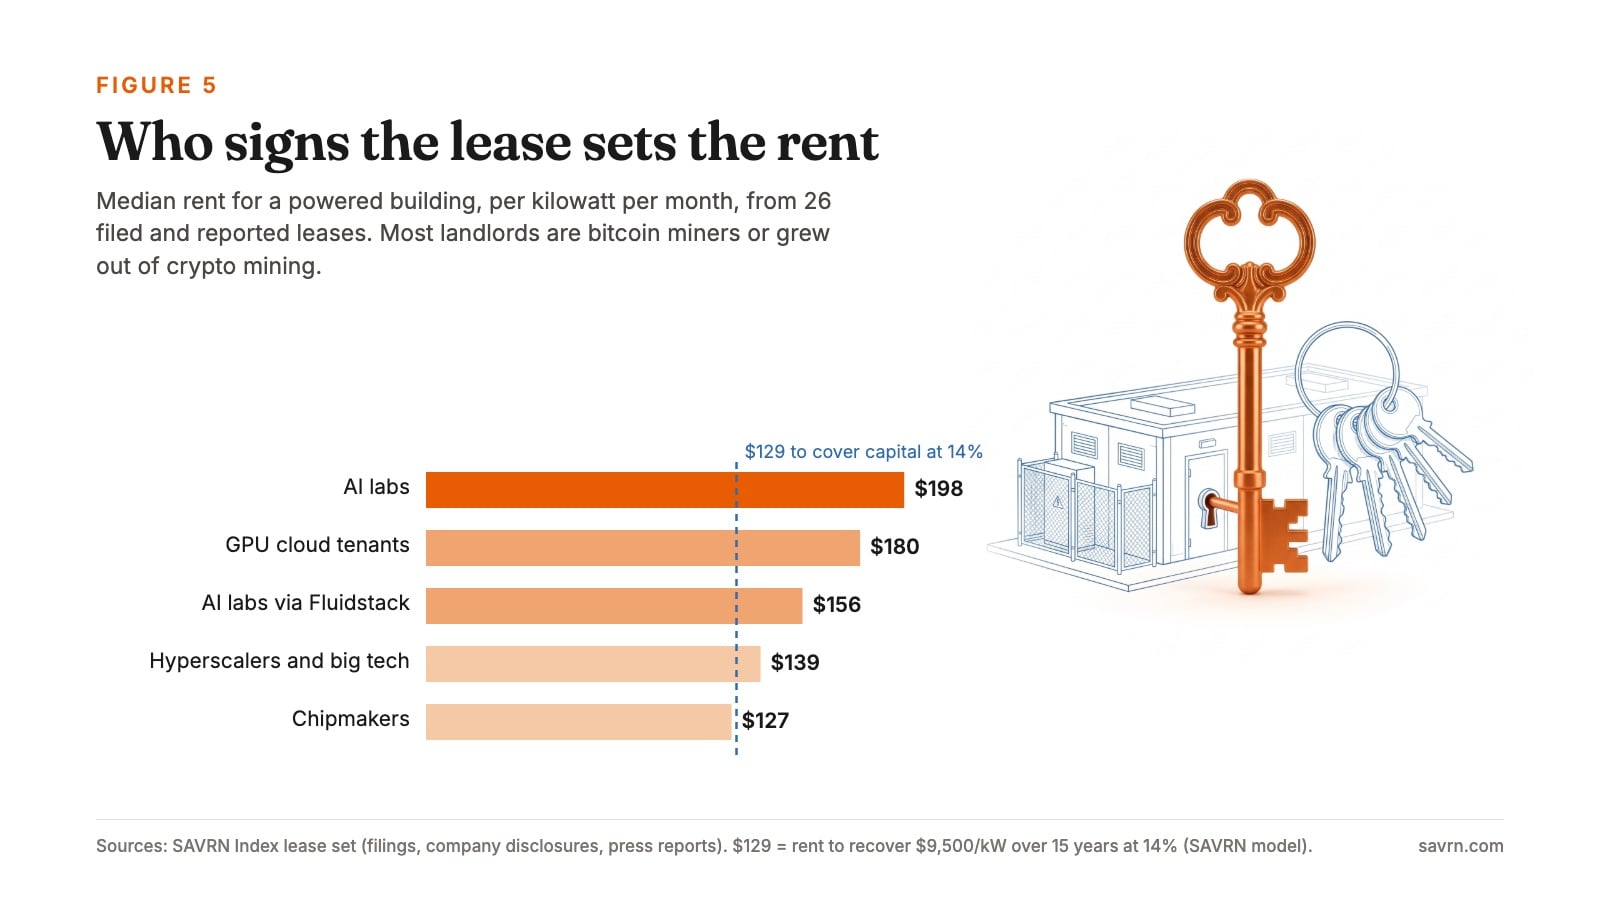
The landlord side of this market has the same split. Our Index holds 26 shell leases where a rent per kilowatt-month can be worked out from filings, company disclosures or press reports.<sup class="cite"><a href="https://savrn.com/ai-index/pricing/wholesale" rel="noopener" title="SAVRN Index: Wholesale and landlord pricing">4</a></sup> Most of the landlords are bitcoin miners or companies that grew out of crypto mining.

The rent depends heavily on who signs:

- **AI labs, directly or through a dedicated developer,** paid a median of about $198 per kW-month. Examples include Riot at $198.50 and TeraWulf at $197.40 with Anthropic, and Bitdeer at $202.31 for a lease in Norway serving a leading AI lab.<sup class="cite"><a href="https://savrn.com/ai-index/pricing/wholesale" rel="noopener" title="SAVRN Index: Wholesale and landlord pricing">4</a></sup>
- **GPU cloud tenants** such as CoreWeave, Nscale and Cerebras paid a median of about $180.<sup class="cite"><a href="https://savrn.com/ai-index/pricing/wholesale" rel="noopener" title="SAVRN Index: Wholesale and landlord pricing">4</a></sup>
- **AI labs through Fluidstack** paid a median of about $156.<sup class="cite"><a href="https://savrn.com/ai-index/pricing/wholesale" rel="noopener" title="SAVRN Index: Wholesale and landlord pricing">4</a></sup>
- **Hyperscalers and other big tech tenants** paid a median of about $139, with one Applied Digital lease at $96.90.<sup class="cite"><a href="https://savrn.com/ai-index/pricing/wholesale" rel="noopener" title="SAVRN Index: Wholesale and landlord pricing">4</a></sup>
- **Chipmakers** paid $103.70 and $150 in the two AMD leases.<sup class="cite"><a href="https://savrn.com/ai-index/pricing/wholesale" rel="noopener" title="SAVRN Index: Wholesale and landlord pricing">4</a></sup>

<figure class="bfig"><img src="/media/blog-neocloud-pricing-leases-v2-20261026.jpg" alt="Copper key in a blueprint data center beside bars of median lease rent by tenant type" width="1600" height="900" loading="lazy"><figcaption><b>Figure 5.</b> Median rent per kW-month by who signed the lease. AI labs pay the most; hyperscalers and chipmakers sit closest to the $129 needed to cover capital at 14%. Chart: SAVRN.</figcaption></figure>

In other words, the cheapest rent went to the strongest credit. That is not irrational, since an investment-grade tenant makes the building easier to finance. It is, however, the miner's instinct at work: lock in the safest buyer and borrow against it. As a result, the lowest rents leave very little room above the cost of the building itself.

## The capital floor

In our "Twenty Cents to Twenty-Five Dollars" analysis, we modeled a developer that spends $9,500 per kilowatt and recovers it over 15 years.<sup class="cite"><a href="https://savrn.com/blog/twenty-cents-to-twenty-five-dollars" rel="noopener" title="SAVRN: Twenty Cents to Twenty-Five Dollars">5</a></sup> The rent needed just to pay back that capital depends on what the money costs:

<div class="btab"><div class="btab-cap"><b>Table 2</b> Rent needed to recover $9,500/kW over 15 years, per kW-month (SAVRN calculation)</div><div class="brows"><div class="br"><span class="br-k">8% cost of capital</span><span class="br-v">$92.49</span><span class="br-b">Margin at $128 rent: $35.51. Rent for 1.25x cover: $115.61 <sup class="cite"><a href="https://savrn.com/blog/twenty-cents-to-twenty-five-dollars" rel="noopener" title="SAVRN: Twenty Cents to Twenty-Five Dollars">5</a></sup></span></div><div class="br"><span class="br-k">10% cost of capital</span><span class="br-v">$104.08</span><span class="br-b">Margin at $128 rent: $23.92. Rent for 1.25x cover: $130.10 <sup class="cite"><a href="https://savrn.com/blog/twenty-cents-to-twenty-five-dollars" rel="noopener" title="SAVRN: Twenty Cents to Twenty-Five Dollars">5</a></sup></span></div><div class="br"><span class="br-k">12% cost of capital</span><span class="br-v">$116.24</span><span class="br-b">Margin at $128 rent: $11.76. Rent for 1.25x cover: $145.29 <sup class="cite"><a href="https://savrn.com/blog/twenty-cents-to-twenty-five-dollars" rel="noopener" title="SAVRN: Twenty Cents to Twenty-Five Dollars">5</a></sup></span></div><div class="br"><span class="br-k">14% cost of capital</span><span class="br-v">$128.89</span><span class="br-b">Margin at $128 rent: −$0.89. Rent for 1.25x cover: $161.11 <sup class="cite"><a href="https://savrn.com/blog/twenty-cents-to-twenty-five-dollars" rel="noopener" title="SAVRN: Twenty Cents to Twenty-Five Dollars">5</a></sup></span></div><div class="br"><span class="br-k">15.78% cost of capital</span><span class="br-v">$140.53</span><span class="br-b">Margin at $128 rent: −$12.53. Rent for 1.25x cover: $175.66 <sup class="cite"><a href="https://savrn.com/blog/twenty-cents-to-twenty-five-dollars" rel="noopener" title="SAVRN: Twenty Cents to Twenty-Five Dollars">5</a></sup></span></div></div></div>

Applying the same method at a 14% cost of capital, the building needs about $128.89 per kW-month before any operating cost, tax or profit. Of the 26 shell leases in our set, only 2 sit below that line. However, 9 of 26 sit below $145.29, the rent that leaves a 25% cushion at a 12% cost of capital.<sup class="cite"><a href="https://savrn.com/ai-index/pricing/wholesale" rel="noopener" title="SAVRN Index: Wholesale and landlord pricing">4</a></sup> Those are the leases with the least room if construction runs over, the power bill rises or refinancing costs more.

The arithmetic is simple. If the cost of capital rises while rent stays fixed, the margin moves from the owner to the lender. Therefore, at least one lever has to move: higher rent, longer and stronger commitments, cheaper money, lower build cost or more equity. Scale does not fix a thin margin. Instead, it multiplies it.

## Price and utilization move together

GPU clouds face the same math one layer up. Specifically, a simple revenue model is installed GPUs times 8,760 hours times the realized price times billed utilization.

Consider 1,000 GPUs. At $4.35 an hour and 85% utilization, they earn about $32.39 million a year. If the realized price rises to $5.83, utilization can fall to about 63.4% while revenue stays the same. At 70% utilization, the higher price earns about $35.75 million, roughly 10.4% more. By contrast, $1.99 an hour at 95% utilization earns only about $16.56 million, about half.

Full machines are not the goal, because utilization bought with a discount can sink the balance sheet. Instead, the goal is cash return per installed GPU. That is the opposite of the mining scorecard, where every idle hour is lost money.

The long-term contracts in our Index point the same way. In September 2025, Microsoft locked GB300 capacity from Nebius at an implied $3.97 per GPU-hour over five years.<sup class="cite"><a href="https://savrn.com/ai-index/pricing/wholesale" rel="noopener" title="SAVRN Index: Wholesale and landlord pricing">4</a></sup> By August 2026, Anthropic's reported deals with Nscale and Lambda worked out to an estimated $5.83 and $5.96 to $7.16.<sup class="cite"><a href="https://savrn.com/ai-index/pricing/wholesale" rel="noopener" title="SAVRN Index: Wholesale and landlord pricing">4</a></sup> No party has confirmed Lambda's terms, and the 2026 figures are our estimates. The later contracts are priced well above the 2025 one, although they cover newer GPUs.

## A demand boom and a shakeout can both be true

Demand is not the problem, because the market keeps growing. Synergy Research Group measured more than $25 billion of neocloud revenue in 2025 and forecasts nearly $400 billion by 2031.<sup class="cite"><a href="https://www.srgresearch.com/articles/neocloud-market-forecast-to-approach-400b-by-2031-driven-by-surging-ai-infrastructure-demand" rel="noopener" title="Synergy Research Group: Neocloud market forecast to approach $400B by 2031">17</a></sup> Physical capacity is scarce, too. For example, CBRE reports that primary-market vacancy held at 1.4% in the first half of 2026, with asking rents rising for every major deployment size.<sup class="cite"><a href="https://www.cbre.com/insights/books/north-america-data-center-trends-h1-2026" rel="noopener" title="CBRE: North America Data Center Trends H1 2026, September 2026">18</a></sup>

Yet Gartner expects more than 80% of neocloud providers to stop operating independently by 2030.<sup class="cite"><a href="https://www.gartner.com/en/newsroom/press-releases/2026-10-14-gartner-says-over-us-dollars-three-and-a-half-trillion-of-artificial-intelligence-infrastructure-spending-could-be-exposed-to-impairment-by-the-end-of-2030" rel="noopener" title="Gartner: Over $3.5 trillion of AI infrastructure spending could be exposed to impairment by 2030, October 14, 2026">8</a></sup> Both forecasts can hold at once, because industry revenue and provider count are different numbers. When a provider fails, its GPUs do not vanish. Instead, they move to an owner who can earn a return on them.

Scarcity also explains where pricing power lives. A provider with capacity that is powered, liquid-cooled and available now is selling time to compute. On the other hand, a provider selling capacity in a delayed project cannot command the same premium, since the buyer pays to avoid a delay, not for a GPU label.

## Two balance sheets

The two largest listed neoclouds show how differently this plays out. From October 13, 2025 to October 23, 2026, CoreWeave's share price fell 61.7% while Nebius rose 17.2%.<sup class="cite"><a href="https://www.nasdaq.com/market-activity/stocks/crwv/historical" rel="noopener" title="Nasdaq: CoreWeave (CRWV) historical prices">16</a></sup><sup class="cite"><a href="https://www.nasdaq.com/market-activity/stocks/nbis/historical" rel="noopener" title="Nasdaq: Nebius Group (NBIS) historical prices">19</a></sup>

<div class="btab"><div class="btab-cap"><b>Table 3</b> CoreWeave and Nebius, second quarter of 2026</div><div class="brows"><div class="br"><span class="br-k">Revenue</span><span class="br-v">$2.575B</span><span class="br-b">CoreWeave. Nebius: $582.3M <sup class="cite"><a href="https://www.sec.gov/Archives/edgar/data/1769628/000176962826000366/R4.htm" rel="noopener" title="CoreWeave: Q2 2026 Form 10-Q, income statement">7</a></sup></span></div><div class="br"><span class="br-k">Adjusted EBITDA margin</span><span class="br-v">59%</span><span class="br-b">CoreWeave. Nebius: 41% group, 49.7% AI cloud <sup class="cite"><a href="https://www.sec.gov/Archives/edgar/data/1513845/000110465926094568/tm2622968d1_ex99-2.htm" rel="noopener" title="Nebius Group: Q2 2026 shareholder letter (SEC exhibit 99.2)">6</a></sup></span></div><div class="br"><span class="br-k">Net loss</span><span class="br-v">$626M</span><span class="br-b">CoreWeave. Nebius: $190.4M from continuing operations <sup class="cite"><a href="https://www.sec.gov/Archives/edgar/data/1513845/000110465926094844/nbis-20260812xex99d1.htm" rel="noopener" title="Nebius Group: Q2 2026 results (SEC exhibit 99.1), August 12, 2026">20</a></sup></span></div><div class="br"><span class="br-k">Net interest expense</span><span class="br-v">$640M</span><span class="br-b">CoreWeave, second quarter <sup class="cite"><a href="https://www.sec.gov/Archives/edgar/data/1769628/000176962826000366/R4.htm" rel="noopener" title="CoreWeave: Q2 2026 Form 10-Q, income statement">7</a></sup></span></div><div class="br"><span class="br-k">Backlog</span><span class="br-v">~$104B</span><span class="br-b">CoreWeave at June 30, plus more than $25B added in early Q3 <sup class="cite"><a href="https://www.sec.gov/Archives/edgar/data/1769628/000176962826000362/coreweave2q26earningspress.htm" rel="noopener" title="CoreWeave: Q2 2026 earnings release (SEC)">21</a></sup></span></div><div class="br"><span class="br-k">Expected payback on new deals</span><span class="br-v">1 yr 10 mo</span><span class="br-b">Nebius second-quarter deals, down from two to three years <sup class="cite"><a href="https://www.sec.gov/Archives/edgar/data/1513845/000110465926094568/tm2622968d1_ex99-2.htm" rel="noopener" title="Nebius Group: Q2 2026 shareholder letter (SEC exhibit 99.2)">6</a></sup></span></div></div></div>

CoreWeave shows that very large revenue and backlog can sit beside heavy interest costs and a net loss. In the second quarter of 2026, it reported $2.575 billion of revenue and about $104 billion of backlog. However, it also reported $640 million of net interest expense and a $626 million net loss.<sup class="cite"><a href="https://www.sec.gov/Archives/edgar/data/1769628/000176962826000362/coreweave2q26earningspress.htm" rel="noopener" title="CoreWeave: Q2 2026 earnings release (SEC)">21</a></sup><sup class="cite"><a href="https://www.sec.gov/Archives/edgar/data/1769628/000176962826000366/R4.htm" rel="noopener" title="CoreWeave: Q2 2026 Form 10-Q, income statement">7</a></sup> In the first half, it spent about $14.1 billion on property and equipment against $3.7 billion of operating cash flow.<sup class="cite"><a href="https://www.sec.gov/Archives/edgar/data/1769628/000176962826000366/R6.htm" rel="noopener" title="CoreWeave: Q2 2026 Form 10-Q, cash flow statement">22</a></sup> Rapid growth can justify outside capital. Still, it makes financing a core operating variable. We looked at what CoreWeave's bond selloff does and does not say about the rest of the industry in [The Data Center Industry Is Not One Business Model](/blog/data-center-industry-not-one-business-model).

Nebius, by contrast, shows what pricing and contract design can change. Its second-quarter letter says the quarter's deals averaged more than $20 million of annual contract value per megawatt, led by four large deals at $20 million to $25 million.<sup class="cite"><a href="https://www.sec.gov/Archives/edgar/data/1513845/000110465926094568/tm2622968d1_ex99-2.htm" rel="noopener" title="Nebius Group: Q2 2026 shareholder letter (SEC exhibit 99.2)">6</a></sup> It also described a short-term price opportunity of $40 million to $50 million per megawatt and said it had signed its first such deal.<sup class="cite"><a href="https://www.sec.gov/Archives/edgar/data/1513845/000110465926094568/tm2622968d1_ex99-2.htm" rel="noopener" title="Nebius Group: Q2 2026 shareholder letter (SEC exhibit 99.2)">6</a></sup> About 70% of second-quarter deals included prepayments, which covered 50% to 60% of the related capex. Management expects those deals to pay back in 1 year and 10 months.<sup class="cite"><a href="https://www.sec.gov/Archives/edgar/data/1513845/000110465926094568/tm2622968d1_ex99-2.htm" rel="noopener" title="Nebius Group: Q2 2026 shareholder letter (SEC exhibit 99.2)">6</a></sup> It also said it could sell all its planned 2027 capacity on existing terms, but was holding some back for higher-value urgent needs.<sup class="cite"><a href="https://www.sec.gov/Archives/edgar/data/1513845/000110465926094568/tm2622968d1_ex99-2.htm" rel="noopener" title="Nebius Group: Q2 2026 shareholder letter (SEC exhibit 99.2)">6</a></sup>

That is not a higher list price. Rather, it is a portfolio: anchor contracts that support financing, mid-term contracts with a fast payback and scarce short-term capacity priced for urgency. Nebius tied its first $775 million secured facility to deployed GPUs and contracted cash flows from an investment-grade customer, at SOFR plus 2.50%.<sup class="cite"><a href="https://www.sec.gov/Archives/edgar/data/1513845/000110465926094568/tm2622968d1_ex99-2.htm" rel="noopener" title="Nebius Group: Q2 2026 shareholder letter (SEC exhibit 99.2)">6</a></sup> In short, better contracts made the debt cheaper. Nevertheless, it still reported a $190.4 million net loss from continuing operations for the quarter, so prepayments do not make capex disappear.<sup class="cite"><a href="https://www.sec.gov/Archives/edgar/data/1513845/000110465926094844/nbis-20260812xex99d1.htm" rel="noopener" title="Nebius Group: Q2 2026 results (SEC exhibit 99.1), August 12, 2026">20</a></sup>

## When raising prices fails

None of this means every neocloud can simply raise prices. In fact, a price increase fails when the product is interchangeable, when delivery is unreliable or when the customer can switch to a cheaper credible option tomorrow.

It also fails when the customer's own AI economics are weak. If an enterprise cannot make money from its workload, a higher rate just speeds up churn. For that reason, choosing customers is part of survival. Well-funded model companies, institutions with dedicated budgets and time-critical workloads can carry a premium, while speculative buyers usually cannot.

Pricing power has to be earned with things the customer values and cannot easily replace:

- **Time to compute.** Powered, cooled capacity on a date the provider can prove.
- **Goodput.** Completed training and inference work, not just GPU hours.
- **Reliability.** Measured uptime, failure handling and service history.
- **Control.** Data location, governance and auditability.
- **Contract certainty.** Prepayments, take-or-pay terms, escalators and remedies.

## What changes inside the company

Escaping miner DNA is not a rebrand, because it changes who decides what gets built.

In a mining company, power and site come first, and the team looks for a tenant later. In an AI company, by contrast, the workload, the customer, the delivery date and the contract economics have to be approved together. Engineering has to answer for workload performance, not just cost per megawatt. Similarly, sales has to answer for realized margin and cash collected, not just contracted megawatts. Finally, finance has to judge each contract after the cost of capital and delivery risk.

The scorecard has to change too. A dashboard of power cost, megawatts built, uptime and GPU count rewards the old behavior. Instead, a dashboard of realized price, utilization, goodput, payback, return on capital and renewal rate rewards the new one. Until the incentives change, the old DNA keeps making the decisions, whatever the investor deck says.

In fact, the right move will sometimes look like failure on the old dashboard. It might mean turning down a low-value contract, slowing expansion or building less. However, on a cash-return dashboard, that is often exactly what survival requires.

## What buyers should do

Buyers can make the mirror-image mistake. A procurement team that chases the lowest GPU-hour can end up paying more, because of late delivery, weak throughput, downtime, migration or unsupported workloads.

Therefore, the right benchmark is total cost per useful outcome: per completed training run, per inference workload or per production system, including engineering time and delay. A premium makes sense when it cuts those costs by more than the price difference.

At the same time, buyers should not accept price increases without evidence. Instead, they should ask for comparable benchmarks, service history and clear service credits, and negotiate flexibility in contract length and portability where they can. If a provider cannot show why its offer is better, switching to a cheaper credible option is the rational move. In fact, that customer discipline is exactly why undifferentiated neoclouds cannot simply raise prices.

## Where SAVRN fits, and what we still have to prove

I should be clear about our own position. SAVRN designs, builds and operates AI factories with on-site power, water-free cooling and a training institute for the local workforce. As a result, our pitch is delivery certainty and institutional control, not the cheapest GPU-hour.

That pitch is only worth something if it is measured. Specifically, we will have to show energization dates met, measured goodput, cooling performance, security and local hiring. Until we do, "community" and "control" are words, not prices. The analysis above holds us to the same test it applies to everyone else.

For that reason, we built the Index to hold ourselves to the same standard. It shows the full cost of capacity, from rent and power to the GPU-hour and the contract, so a buyer can compare total cost per useful outcome rather than one isolated quote.<sup class="cite"><a href="https://savrn.com/ai-index/pricing/colocation" rel="noopener" title="SAVRN Index: Colocation pricing">23</a></sup>

## What to watch next

Musk's post is a claim about how outcomes will spread, not about demand. Over the next few quarters, a short list of signals will show whether he is right, and for whom:

- **Realized prices by contract cohort.** Do higher rates hold without utilization falling?
- **Customer prepayments.** Do they stay large, with delivery dates met?
- **Contract length versus debt length.** Do customer commitments cover the financing?
- **Secured debt spreads.** Do they tighten for more than a few leaders?
- **Older GPUs at renewal.** Nebius reported more than 30% higher pricing on older-generation GPUs in the second quarter than in the first.<sup class="cite"><a href="https://www.sec.gov/Archives/edgar/data/1513845/000110465926094568/tm2622968d1_ex99-2.htm" rel="noopener" title="Nebius Group: Q2 2026 shareholder letter (SEC exhibit 99.2)">6</a></sup> If that spreads, demand is absorbing the installed base.
- **Our own index.** If list prices keep rising while discounts quietly grow, the increase is not real.

## The bottom line

The neocloud shakeout will not come from AI demand drying up. Instead, it will come from operators selling below what their capacity costs to own and finance. For many of them, that means prices have to rise. More precisely, lifetime cash return has to beat the full cost of capital and risk, through price, contract terms, prepayments, utilization or cheaper money.

Miner DNA is the warning. Power, construction and hardware skills are worth keeping, while the price taker's habits are not. Ultimately, the operators that survive will sell time to compute, reliability, goodput, control and contract certainty, and charge for what they can prove. The rest will be consolidated into someone who can.

Lenders are already sorting them. However, the data says the sorting is not about demand. Rather, it is about price.

*Chad Everett Harris is the founder of SAVRN. Prices checked October 26, 2026. This article is general information, not investment, legal or financial advice, and not a recommendation on any security.*

<details class="bsrc">
<summary>Sources</summary>
<ol>
<li id="src-1"><a href="https://siliconangle.com/2026/10/25/elon-musk-predicts-neocloud-shakeout-as-credit-for-ai-infrastructure-dries-up/" rel="noopener">SiliconANGLE: Elon Musk predicts neocloud shakeout as credit for AI infrastructure dries up, October 25, 2026</a>; Musk&#x27;s X post: $40B of GPU debt, investment grade, debt markets shut off, 200+ neoclouds</li><li id="src-2"><a href="https://savrn.com/ai-index/pricing/history" rel="noopener">SAVRN Index: Price history and methodology</a>; Daily checks since September 11, 2026; same-item chained index of list prices</li><li id="src-3"><a href="https://savrn.com/ai-index/pricing/history" rel="noopener">SAVRN Index price database: daily GPU price checks, September 11 to October 26, 2026</a>; Item-level records behind the published index, including spot, serverless and reserved prices; not every item is shown on a public page</li><li id="src-4"><a href="https://savrn.com/ai-index/pricing/wholesale" rel="noopener">SAVRN Index: Wholesale and landlord pricing</a>; Filed shell leases by tenant and implied per-GPU-hour capacity deals</li><li id="src-5"><a href="https://savrn.com/blog/twenty-cents-to-twenty-five-dollars" rel="noopener">SAVRN: Twenty Cents to Twenty-Five Dollars</a>; Developer, AI cloud and model company economics per kW-month; $9,500/kW, 15-year reference case</li><li id="src-6"><a href="https://www.sec.gov/Archives/edgar/data/1513845/000110465926094568/tm2622968d1_ex99-2.htm" rel="noopener">Nebius Group: Q2 2026 shareholder letter (SEC exhibit 99.2)</a>; Contract mix, ACV per MW, prepayments, payback, secured facility</li><li id="src-7"><a href="https://www.sec.gov/Archives/edgar/data/1769628/000176962826000366/R4.htm" rel="noopener">CoreWeave: Q2 2026 Form 10-Q, income statement</a>; Net interest expense, operating loss, net loss</li><li id="src-8"><a href="https://www.gartner.com/en/newsroom/press-releases/2026-10-14-gartner-says-over-us-dollars-three-and-a-half-trillion-of-artificial-intelligence-infrastructure-spending-could-be-exposed-to-impairment-by-the-end-of-2030" rel="noopener">Gartner: Over $3.5 trillion of AI infrastructure spending could be exposed to impairment by 2030, October 14, 2026</a>; AI-optimized IaaS spending and neocloud consolidation forecast</li><li id="src-9"><a href="https://savrn.com/ai-index/pricing/gpus" rel="noopener">SAVRN Index: GPU cloud pricing</a>; 229 GPU prices from 27 providers across 10 GPUs; H100 on-demand offers</li><li id="src-10"><a href="https://savrn.com/ai-index/pricing" rel="noopener">SAVRN Index: Pricing</a>; 797 prices from 55 providers across four markets</li><li id="src-11"><a href="https://newsletter.semianalysis.com/p/the-great-gpu-shortage-rental-capacity" rel="noopener">SemiAnalysis: The Great GPU Shortage, Rental Capacity, April 2, 2026</a>; H100 one-year rental contract index from $1.70/hr (October 2025) to $2.35/hr (March 2026)</li><li id="src-12"><a href="https://www.eia.gov/todayinenergy/detail.php?id=61364" rel="noopener">U.S. EIA: Today in Energy, cryptocurrency mining electricity use</a>; Electricity as miners&#x27; main operating cost</li><li id="src-13"><a href="https://ccaf.io/cbnsi/cbeci/methodology" rel="noopener">Cambridge Centre for Alternative Finance: CBECI methodology</a>; Mining profitability from electricity price, hardware efficiency and PUE</li><li id="src-14"><a href="https://cointelegraph.com/news/crusoe-to-sell-bitcoin-mining-business-nydig-to-focus-on-ai" rel="noopener">Cointelegraph: Crusoe to sell bitcoin mining business to NYDIG to focus on AI, March 25, 2025</a>; Founded 2018 on flare gas; more than 425 modular data centers; sale to NYDIG</li><li id="src-15"><a href="https://www.zawya.com/en/special-coverage/ai-infrastructure-provider-crusoe-valued-at-30.9bln-in-latest-funding-round-982627" rel="noopener">Reuters via Zawya: AI infrastructure provider Crusoe valued at $30.9 billion in latest funding round, September 18, 2026</a>; Series F, $3.9 billion raised at $30.9 billion post-money</li><li id="src-16"><a href="https://www.nasdaq.com/market-activity/stocks/crwv/historical" rel="noopener">Nasdaq: CoreWeave (CRWV) historical prices</a>; Closes of $141.62 on October 13, 2025, $55.60 on October 22, 2026 and $54.235 on October 23, 2026; market value from the 10-Q share count</li><li id="src-17"><a href="https://www.srgresearch.com/articles/neocloud-market-forecast-to-approach-400b-by-2031-driven-by-surging-ai-infrastructure-demand" rel="noopener">Synergy Research Group: Neocloud market forecast to approach $400B by 2031</a>; 2025 neocloud revenue and 2031 forecast</li><li id="src-18"><a href="https://www.cbre.com/insights/books/north-america-data-center-trends-h1-2026" rel="noopener">CBRE: North America Data Center Trends H1 2026, September 2026</a>; Primary-market vacancy held at 1.4%; asking rents rose for every major deployment size</li><li id="src-19"><a href="https://www.nasdaq.com/market-activity/stocks/nbis/historical" rel="noopener">Nasdaq: Nebius Group (NBIS) historical prices</a>; Closes of $135.46 on October 13, 2025 and $158.74 on October 23, 2026</li><li id="src-20"><a href="https://www.sec.gov/Archives/edgar/data/1513845/000110465926094844/nbis-20260812xex99d1.htm" rel="noopener">Nebius Group: Q2 2026 results (SEC exhibit 99.1), August 12, 2026</a>; Q2 net loss</li><li id="src-21"><a href="https://www.sec.gov/Archives/edgar/data/1769628/000176962826000362/coreweave2q26earningspress.htm" rel="noopener">CoreWeave: Q2 2026 earnings release (SEC)</a>; Revenue, adjusted EBITDA, backlog</li><li id="src-22"><a href="https://www.sec.gov/Archives/edgar/data/1769628/000176962826000366/R6.htm" rel="noopener">CoreWeave: Q2 2026 Form 10-Q, cash flow statement</a>; H1 operating cash flow, equipment purchases, financing cash flow</li><li id="src-23"><a href="https://savrn.com/ai-index/pricing/colocation" rel="noopener">SAVRN Index: Colocation pricing</a>; All-in AI factory cost per kW-month by market; typical $277</li>
</ol>
</details>

## Frequently asked questions

### What is a neocloud?

A neocloud is a company that rents GPU computing capacity for AI, usually without the broad service catalog of a hyperscaler like AWS, Azure or Google Cloud. In fact, many neoclouds and AI data center landlords started as bitcoin miners.

### What did Elon Musk say about neoclouds?

On October 25, 2026, Musk posted that SpaceX closed $40 billion of GPU debt because it is investment grade. He also said debt markets had almost entirely shut off for companies without substantial revenue independent of AI data centers, and that "200+ neoclouds are going to see guppy-level death and consolidation."

### Are GPU cloud prices falling?

Not in our data. The SAVRN Index same-item list-price index for GPU cloud rose 6.1% from September 11 to October 26, 2026. In addition, of 182 GPU prices we followed in that period, 43 rose while 3 fell.

### How much does an H100 cost per hour?

Our latest check found 31 standard on-demand H100 prices, from $1.99 to $12.29 per GPU-hour, with a median of $4.09. The hyperscalers' standard on-demand rates ran $10.00 to $12.29.

### What is miner DNA?

Miner DNA is the operating habit of a bitcoin miner: find the cheapest power, build the cheapest shell and maximize uptime, because the output price is fixed. Carried into AI, those habits produce a commodity product with no pricing power.

### Why do AI labs pay higher rent than hyperscalers?

In our lease data, AI labs, directly or through a dedicated developer, paid a median of about $198 per kW-month, while hyperscalers and big tech paid about $139. AI labs often need capacity fast, whereas investment-grade hyperscalers can use their credit to negotiate lower rent.

### What rent does an AI data center need to cover its capital?

In our reference case of $9,500 per kilowatt over 15 years, the rent needed is about $104.08 per kW-month at a 10% cost of capital. At 14%, however, it rises to about $128.89.

### Can neoclouds survive by raising prices?

Only if the product earns it. A price increase works when the provider sells something buyers value and cannot easily replace, such as time to compute, reliability, goodput or control. Otherwise, undifferentiated capacity loses customers instead.

### How is Nebius different from CoreWeave?

Both grew fast. CoreWeave reported $2.575 billion of second-quarter revenue alongside a $626 million net loss and heavy interest costs. By contrast, Nebius reported prepayments covering 50% to 60% of capex on most new deals and a 1 year 10 month expected payback.

### Will most neoclouds fail?

Gartner expects more than 80% of neocloud providers to stop operating independently by 2030. In our view, most of their GPUs and contracts would move to stronger owners rather than disappear.