Twenty Cents to Twenty-Five Dollars
That is one million Claude Opus 5 tokens, priced two ways. Twenty cents is what the silicon costs to serve them. Twenty-five dollars is the list price. Both are true, and almost everything that looks irrational about AI infrastructure spending lives in the distance between them.
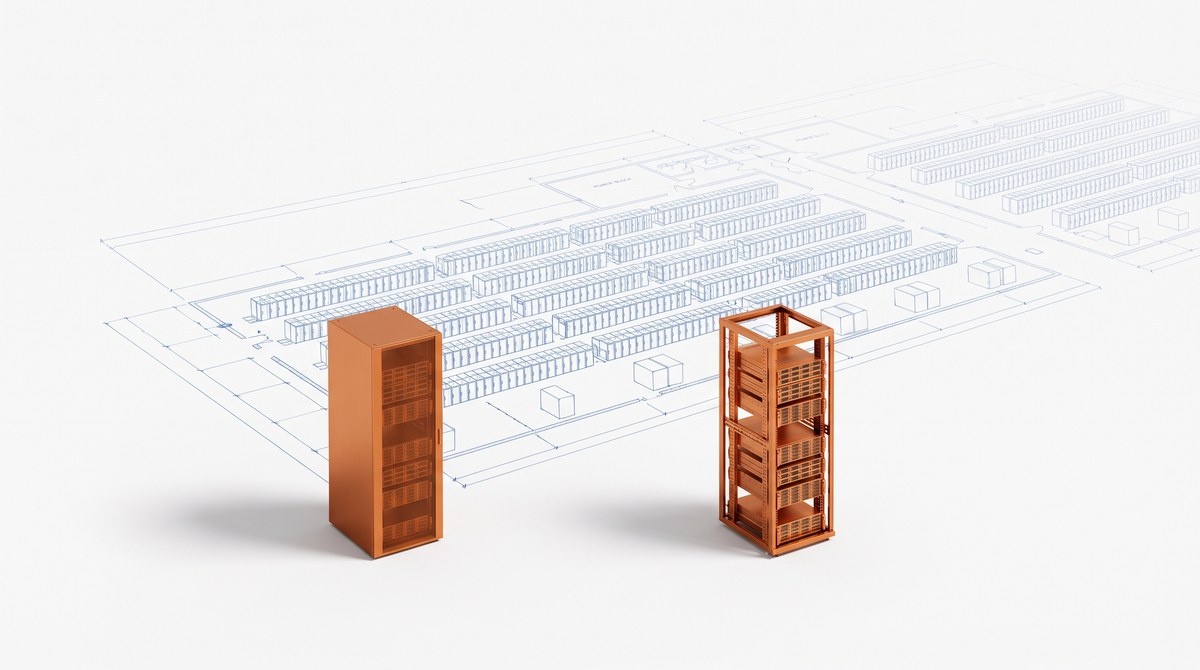
A million tokens of Claude Opus 5 output lists at twenty-five dollars, while the silicon that produces that million costs about twenty cents to run. However, I want to be careful about what that sentence does and does not claim, because the gap between those two numbers is where most of the confused argument about AI infrastructure spending happens.
I did not start here. Rather, I started with a client conversation. Specifically, a university team told me their number was a hundred and twenty five dollars a kilowatt-month, that this was the market, and that what I was quoting looked expensive. In fact they were not wrong about the hundred and twenty five. Instead, they were comparing a rent line to an all-in number, which are different products sold in different units, and once you do that the conversation cannot resolve.
Therefore I pulled every disclosed contract I could find. Forty-seven of them, across sixteen publicly traded filers, plus twenty-four private operators and seventy-nine published GPU-hour rates. Finally I priced the whole chain end to end in one unit. This is what came out.
First, who is who
The word neocloud gets applied to two different businesses, and that single ambiguity arguably causes more pricing confusion than any other thing in this market. Importantly, the two are not tiers of one industry; they are separate businesses with separate balance sheets.
First, Core Scientific, Hut 8, TeraWulf, Cipher, Applied Digital, CleanSpark and Riot develop and own the buildings. Specifically, they bought the land, built the shell, fitted it out, and lease it. Second, CoreWeave, Nebius, Lambda and Together lease that space, install their own accelerators and sell compute. Although both groups get called neoclouds, their economics are nothing alike, and a rate quoted by one is not comparable to a rate quoted by the other.
There is a third group, and it is the one worth watching. IREN, Nscale, Bitdeer and HIVE own the site and the silicon. IREN's own filings describe it as full-stack and landlord across Childress and Sweetwater. Nscale is developing Monarch, generating its own power on site, and selling the compute that comes out of it. These firms are not renting a floor from anyone and they are not renting machines to anyone. They own the chain. Because they occupy two layers at once, they collect both margins on the same kilowatt, which in the numbers below is $24 plus $363, or $387. Calling them neoclouds undersells what they are. A better word is neoscaler.
Thirty-one of the forty-seven leases in this set are triple-net. Fourteen state power explicitly as tenant pass-through. Opex shows up in the filings as Tenant, or as a roughly one hundred percent NOI margin, which is the landlord confirming that the tenant pays property tax, insurance and maintenance directly. Consequently the tenant's real bill is the rent, plus power, plus all of those, plus whatever it contributes toward improvements.
What a hundred and twenty five dollars actually covers
The quoted colocation rate is not what the tenant pays. Instead it is one line, and on a triple-net lease it is roughly half of the occupancy cost before any equipment arrives.
| Line | $/kW-month | Basis |
|---|---|---|
| Base rent, Year 1 | 128.00 | the number everyone quotes |
| Power pass-through, $0.07/kWh at PUE 1.25 | 63.92 | 730.5 h × 1.25 × $0.07 |
| Triple-net opex: tax, insurance, maintenance | 22.40 | 17.5% of rent, from a disclosed NOI margin |
| Tenant improvements, $1.5M/MW over 15 years | 16.43 | market practice, not a filing |
| Network, fiber, cross-connect | not disclosed | absent from all 47 contracts |
| Occupancy, Year 1 | 230.75 | before any equipment |
| Occupancy, term average at 3% | 261.46 | 2.04× the quoted rate |
Add those and Year-1 occupancy is $230.75 per critical kilowatt-month. Apply the three percent escalator that sits in nearly every one of these contracts and the term-average is $261.46. That is 2.04 times the number that gets quoted, and it still excludes network, fiber and cross-connect, which no contract in this set discloses at all.
Finally, one more figure is worth holding onto. Notably, WhiteFiber files the rent it pays for a bare powered shell in Montreal, and it is $3.40 to $10.60 per kilowatt-month. That is what land, a building and power delivery cost as real estate, and it is one of only two colocation rates disclosed outright anywhere in the set. Consequently, of the $128.00 that gets quoted, under ten dollars is the property. The rest is fit-out, cooling, redundancy, capital recovery and margin. Ultimately the developer is not really renting you a building.
The whole chain, in one unit
Three businesses touch the same physical kilowatt. Reduced to dollars per critical kilowatt-month, they are not close.
Capital cost on $9,500/kW at 15 years and 10%. Triple-net, so it carries almost no opex.
Rent plus power plus triple-net opex plus improvements plus its own accelerators.
Owns no land, no building, no generation and no GPUs. Rents all four.
Margin on the same kilowatt, by who is holding it
Per critical kilowatt-month. Three businesses touch one physical kilowatt of AI capacity.
What the developer charges becomes the tenant's rent line. What the tenant charges becomes the model company's entire compute cost. Nothing is lost between the stages, and the bar gets longer at every handoff.
Notably, a neoscaler collapses the first two rows into one. Because it owns the building it never pays the $128 of rent; it carries the $104 of capital cost instead. Consequently its cost base is $972 rather than $996, and on the same $1,358.70 of compute it keeps $387. That is the developer's margin and the operator's margin landing in one place. IREN, Nscale, Bitdeer and HIVE are all built this way, and it is the reason their disclosed rates are not comparable to either a shell lease or a pure compute contract.
Notably the developer signs a fifteen to twenty-five year obligation, carries the construction risk and the tenant credit risk, and earns twenty-four dollars. Although that works out to a seventeen to eighteen percent development yield, which is a sound infrastructure business, it is simply not where the value in this market is being captured.
Nobody rents one accelerator
A GB300 or Vera Rubin NVL72 is a single rack holding seventy-two accelerators wired into one memory domain. That rack is the unit that gets installed, powered and sold.
Anthropic's contract with Nscale is $45 billion over 6 years for 460 MW. Divide it down and it is $7.5 billion a year, $1,358.70 per kilowatt-month, and $5.83 per accelerator-hour. Multiply that back up by the seventy-two accelerators in a rack and one rack-hour costs $419.76.
Two independent routes through the same contract agree. Dividing by capacity gives $5.83 per accelerator-hour. Dividing by accelerator count gives $5.84. Multiply back up through 2,038 racks and you land on $7.49 billion against a $7.5 billion annual contract. Thus the arithmetic closes, which is the real evidence that the density figure of 319 accelerators per megawatt holds.
One caution on the count. Rubin-generation packages carry two dies, so vendor material moves between NVL72 and NVL144 depending on whether packages or dies are being counted (The Next Platform walks the rack architecture). If the disclosed accelerator figure counts dies rather than packages, a rack costs $839.52 an hour and there are half as many racks. Nevertheless the contract total is identical either way, since only the per-rack figure moves. Therefore confirm which convention a counterparty is using before comparing rack prices.
What a rack actually produces
Throughput was the input I expected to have to assume. It turns out to be measured, published and audited.
MLPerf is the industry's audited inference benchmark, run by MLCommons. In the v6.0 round, Nebius submitted a full-rack GB300 NVL72 system of seventy-two accelerators. On DeepSeek-R1, a 671 billion parameter reasoning model, it produced 575,580 tokens per second in the latency-bound server scenario and 673,936 offline. On gpt-oss-120B it reached 1,096,770.
| Model | Scenario | Tokens/sec, rack | Per accelerator | Compute $/million |
|---|---|---|---|---|
| DeepSeek-R1 | Server, latency-bound | 575,580 | 7,994 | $0.2026 |
| DeepSeek-R1 | Offline, max batch | 673,936 | 9,360 | $0.1730 |
| gpt-oss-120B | Server | 1,096,770 | 15,233 | $0.1063 |
I use the first row throughout, because it is the most conservative published figure that resembles production serving: specifically a very large reasoning model, run under a latency constraint rather than at maximum batch depth. Furthermore, Monarch runs Vera Rubin, a later generation than the GB300 these results were measured on, so using GB300 numbers understates it.
Put the rack cost against the rack output and the answer is twenty cents. Specifically, one rack costs $419.76 an hour while serving 2,072 million tokens in that hour. Across a year, therefore, one rack produces eighteen trillion tokens for $3.68 million of compute.
Marginal cost and average cost are not the same number
This is the distinction the whole market runs on, and almost nothing published makes it.
| Measure | $ per million | What it counts |
|---|---|---|
| Marginal cost of serving | 0.2026 | The rack-hours that produced those tokens, and nothing else |
| Average cost across the business | 1.4866 | The entire compute bill divided by tokens actually sold |
| Realized price, agentic workload | 3.76 | What a customer pays after caching |
| List price, Opus 5 output | 25.00 | The headline |
Take the measured throughput and a realistic agentic workload on a premium model, and a fleet that spent every hour serving paid work would return about eighteen and a half times its compute cost. Anthropic's reported revenue run-rate reached $65 billion at the end of July 2026 (Axios, Aug 17, 2026), against disclosed annualized compute commitments of $25.7 billion. That is 2.53 times, not eighteen.
Those two numbers are seven times apart and neither is an error. The eighteen assumes every accelerator spends every hour serving work somebody pays for. Nothing works that way. Frontier labs spend compute on training runs that sell nothing, on research and evaluations, on free tiers, on safety work, and on the latency headroom that keeps a product responsive when demand spikes. Capacity sits idle between peaks, and the contract is take-or-pay either way.
Reconciling the measured throughput against the reported financials implies that roughly 14 percent of frontier-lab compute is serving tokens a customer pays for. The other eighty-six percent is the cost of having a model worth selling at all. I want to be clear that this is derived, not disclosed, and it moves with the assumed traffic mix. Treat it as an order of magnitude.
Once those three numbers are separated, most of this market's behavior stops being mysterious. Prices fall relentlessly because marginal cost is near zero and any competitor can price toward it. Cached input bills at one tenth of list because that is roughly where marginal cost actually sits. Margins look thin at the company level while looking enormous per token, and both readings are correct. Moreover a lab can commit forty-five billion dollars to a single building without the unit economics being alarming, because the building is not what makes the model expensive.
Set the assumptions yourself
460 MW · 2,038 racks · 146,740 accelerators · $7.5B a year. Everything below is per million tokens, on purpose.
Every layer of this market quotes a ceiling
The gap between a published number and a committed one repeats at every step of the chain. It is the most reliable feature of AI infrastructure pricing.
| Traffic mix | Mid tier | Premium tier | Share of headline |
|---|---|---|---|
| Pure output, the headline case | $10.00 | $25.00 | 100% |
| Chat: 70% input, 30% of it cached | $4.02 | $10.05 | 40% |
| Agentic: 90% input, 80% cached | $1.50 | $3.76 | 15% |
| Heavy-cache agent: 95% input, 90% cached | $0.86 | $2.15 | 9% |
Caching is why list prices and realized revenue diverge so far. Specifically, a cache hit bills at one tenth of the input rate, while an agent re-reads the same context on every turn. Moreover, stack the batch discount on top of caching and a premium input token that lists at five dollars per million bills at twenty-five cents. Same token, same model, twenty times apart.
Whoever quotes a ceiling and compares it to somebody else's floor wins the argument and tells you nothing. That is true when a data center quotes rent, when a cloud quotes an accelerator-hour, and when a lab quotes a token.
| Layer | Headline | Committed floor | Spread |
|---|---|---|---|
| Colocation rent | $128 Year-1 quoted | $1,359 all-in full stack | 10.6× |
| Accelerator-hour, B300 class | $14.04 hyperscaler list | $3.70 three-year contract | 3.8× |
| Accelerator-hour, contract offtake | $5.83 Monarch all-in | $3.40 two-year offtake | 1.7× |
| Tokens, Opus 5 output | $25.00 list | $0.20 marginal serving cost | 123× |
What to actually ask
None of this says anyone is misleading anybody. In fact every number in this piece is real and most of them come from a filing. Rather, the problem is that four different units are in circulation, each one accurate about a different slice of the same kilowatt, while comparisons get made across them without anyone converting first.
Nevertheless that is a solvable problem. Convert everything to one unit, state what the quote excludes, and the argument becomes arithmetic instead of assertion. Ultimately that was the whole point of doing the work.
Questions
Why is colocation rent quoted as a first-year number instead of a term average?
In a data center lease, who actually pays for power?
What does triple-net mean for a data center tenant?
How many accelerators fit in a megawatt?
Why do published prices for the same GPU vary so much between providers?
What does prompt caching do to the effective price of a token?
Is a $45 billion compute contract unusual for this market?
Why does a lab's company-level margin look nothing like its per-token margin?
What does MLPerf actually measure, and why use it here?
What is the single most useful question to ask before comparing two capacity quotes?
Sources
Contract values, capacity, terms and lease structures are taken from SEC filings and company announcements across sixteen public filers and forty-seven contracts. Token prices are from the vendors' own published rate cards, read directly rather than linked, because those organizations are already cited elsewhere on this site. Throughput is the audited MLPerf Inference v6.0 result.
Measured throughput
- MLCommons, MLPerf Inference (datacenter) The audited benchmark suite. Defines the offline and server scenarios used here.
- Nebius, MLPerf Inference v6.0 results Full-rack GB300 NVL72 submission: 575,580 tok/s server and 673,936 offline on DeepSeek-R1.
Rack architecture
- The Next Platform, NVL72 rack architecture Seventy-two accelerators in one NVLink domain, and the package-versus-die counting question.
Company financials
- Axios, August 17, 2026 Anthropic's revenue run-rate reaching $65 billion at the end of July 2026.
Read directly, not linked
- Anthropic and OpenAI published API rate cards All per-million-token list, cached and batch prices. Read from the vendors' own pricing pages on August 29, 2026. Not linked here because both organizations are already cited elsewhere on this site.
- SEC filings, 16 public filers, 47 contracts 8-K, 10-Q and 10-K exhibits for rent structure, power treatment, opex, capacity and term.