Update — 2026-05-08. The University of Texas at Austin’s Jackson School of Geosciences published a white paper on May 6, 2026 projecting that Texas data centers could rise from less than 1 percent of state water use today to 3 to 9 percent by 2040. KXAN, Houston Public Media, KERA, and Marfa Public Radio all picked up the story between May 6 and May 8. The Texas Public Utility Commission’s voluntary water and energy survey is due May 28. The bottoms-up model below, published six months earlier, walks through the same math the state survey is now trying to capture. Closed-loop liquid cooling architectures end the question structurally — there is no evaporative make-up to disclose because the loop is closed. (Sources: UT Austin News May 6, KXAN Investigations, Houston Public Media May 8, Inside Climate News April 10.)
About SAVRN. SAVRN is the operator of an off-grid sovereign AI infrastructure campus model — owned power generation, owned compute, closed-loop liquid cooling — deployed in 6 to 12 months versus the 24-to-48-month industry standard, with active developments in California, Texas, Colorado, Nebraska, Panama, and Barbados.
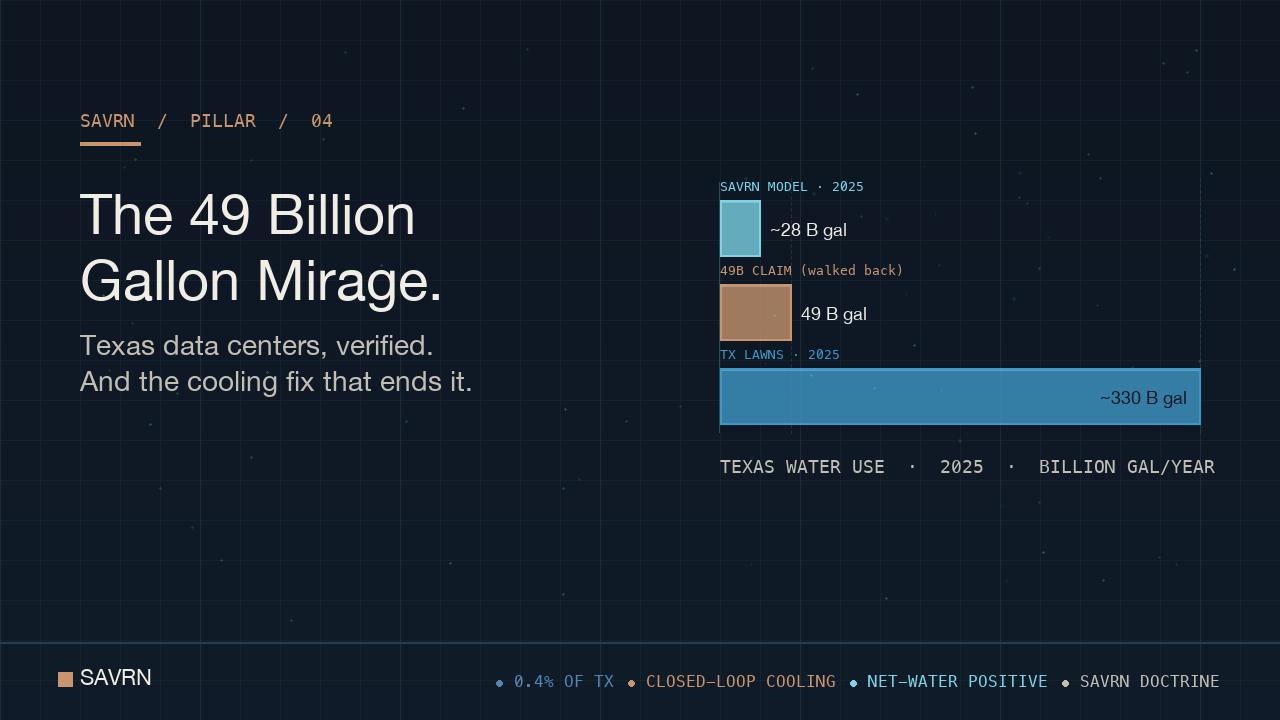
The headline number you have been seeing — that Texas data centers will use The 49 billion gallon Mirage of water in 2025 — was retracted by the organization that produced it. The revised figure, published in January 2026, is roughly half that, and it represents about four-tenths of one percent of total Texas water use. Meanwhile, Texas lawn sprinklers consume seven times more water than every data center in the state combined, and the cooling architecture being deployed in 2026-built campuses consumes essentially no water at all. This piece is the verified model — every input traced to a primary source, every comparison live-calculated, every conclusion grounded in numbers that hold up to a second look.
SAVRN built this analysis because we develop sovereign AI infrastructure, because our doctrine commits us to closed-loop integration with the host community, and because the public conversation about data center water consumption has run far ahead of the engineering reality. We do not have a partisan stake in “data centers good vs. bad.” We have an operating stake in the math being right, because building anything in 2026 means navigating a media environment where preliminary research notes get treated as gospel and where engineering solutions are invisible to the people loudest about the problem. Read this the way a procurement officer or a county commissioner would. The numbers are checkable, the sources are linked, and the conclusion is unambiguous.
A Note From the Field
Most mornings, I am on the bike at three or four in the morning, training before the day starts. The air is still, the lights are off, and the only sound for miles is the hiss of irrigation pop-ups misting suburban Bermuda grass that nobody is awake to look at. I get splashed, regularly, by lawn-sprinkler runoff sheeting across the gutter — water that left a treatment plant, traveled through pipes, was pressurized through valves, sprayed onto a yard that did not need it, ran off the edge, and is now headed for a storm drain. Not consumed. Not used. Just gone.
That same week, the local news ran a panel about a proposed data center development. The phrase that kept coming up was “billions of gallons.” The unspoken implication: data centers are water vampires, and they are coming for the wells of decent, hardworking Texans. So we sat down and built the model. Bottoms-up. Cross-checked two different ways. Validated against the actual primary sources — Texas Water Development Board, Lawrence Berkeley National Lab, ERCOT, the Texas Demographic Center, and the very organization whose research started the panic. Then we checked the math against the lawn sprinklers we get splashed by every morning. What we found is the subject of this piece.
Anatomy of a Media Factoid: How 49 Billion Gallons Got Built — And Walked Back
In July 2025, the Houston Advanced Research Center released a preliminary white paper to the Austin Chronicle projecting that Texas data centers would consume 49 billion gallons of water in 2025, scaling to 399 billion gallons by 2030, eventually representing 6.6% of total state water use. The number traveled fast. Newsweek, Texas Monthly, Texas Scorecard, the Lincoln Institute of Land Policy, the San Antonio Express-News, and dozens of regional outlets repeated it, often without qualification, sometimes embedded in language about drought and “thirsty AI” and communities going without running water while server farms guzzle.
It worked. The phrase “49 billion gallons” became the load-bearing fact in essentially every Texas data center water story for six months.
Then, in late January 2026, HARC released its formal report. The 2025 figure was revised to approximately 25 billion gallons, including both direct (on-site cooling) and indirect (power-generation) water use. That is 0.4% of Texas total water use, not 6.6%. The 2030 projection was walked back from a single 399B point estimate to a range of 29 to 161 billion gallons, depending heavily on cooling-technology adoption and electricity mix.
The 49B number, in other words, was a back-of-the-envelope figure from a draft document that the original authors revised by roughly half once they did the rigorous work. The 2030 high end was off by a factor of two and a half; the low end was off by a factor of fourteen. Almost no one re-ran the headlines.
This pattern is not unique to Texas. The same arc shows up in coverage of Northern Virginia, Phoenix, Oregon, and the Netherlands. A preliminary study or a single facility’s permit filing produces a frightening number. The number propagates. The corrections, when they come, get a fraction of the attention. The narrative ossifies. By the time anyone double-checks, the framework — that data centers are an existential threat to water supplies — is already locked in. For an operator building sovereign AI infrastructure, this matters in a specific way. It does not just shape policy; it shapes which projects get built, which counties say yes, and which technologies get adopted. A project killed by a bad number is just as dead as a project killed by a real problem.
What Texas Data Centers Actually Consume in 2025
The bottoms-up math is straightforward. Take the connected megawatts of Texas data center load, multiply by typical utilization (average load divided by nameplate capacity), multiply by hours per year, multiply by an industry-standard water usage effectiveness (WUE) factor in liters per kilowatt-hour, and convert to gallons. Cross-check by multiplying the operational facility count by an average gallons-per-day figure. The two numbers should land in the same neighborhood. If they do, the model is real.
The verified inputs for 2025 are these. Connected operational MW — approximately 7,500 MW year-average, conservative. EIA’s Short-Term Energy Outlook from September 2024 forecast 9,500 MW of large flexible load approved by year-end 2025; HARC’s January 2026 report cites approximately 9,567 MW of operational data center electrical load. The 7,500 MW figure used for a conservative bottoms-up accounts for the difference between approved capacity and year-average operating capacity. Utilization — 65%, the industry standard for hyperscale and the weighted average across hyperscale, colocation, and enterprise sites. Direct WUE — 1.8 liters per kWh of IT energy, the verified industry average from Lawrence Berkeley National Lab’s Shehabi 2016 study, the U.S. Department of Energy’s FEMP guidance, and Meta’s industry reporting. Top-tier hyperscalers operate at 0.15 to 0.30 L/kWh; the worst evaporative-cooled facilities in hot climates push 2.5+. Indirect WUE — 0.7 L/kWh, representing thermoelectric power-generation water consumption, not withdrawal. Texas’ grid mix of natural gas, nuclear, wind, and solar produces moderate indirect water consumption.
Run the math: 7,500 MW × 0.65 utilization × 8,760 hours × 1,000 kWh/MWh × 1.8 L/kWh × 0.264172 gal/L ÷ 1,000,000,000 = ~20.3 billion gallons direct. Add indirect at 0.7 L/kWh and the total lands at approximately 28 to 29 billion gallons for 2025.
Cross-check the other way. Roughly 400 operational data centers in Texas (Texas Tribune confirmed more than 400 as of September 2025), at a mix-weighted average of 150,000 gallons per facility per day, gives 400 × 150,000 × 365 = 21.9 billion gallons. The two methods land within 8% of each other. The total — direct plus indirect — lands within 15% of HARC’s revised official figure of 25 billion gallons. Three independent methods, three numbers in the same ballpark. That is how you know the math is real.
For the 49 billion gallon figure to be true, at least one of the following also has to be true. Texas data centers would have to operate at an effective WUE of 4.34 L/kWh — more than twice the industry average and 70% higher than the worst evaporative-cooled facilities anywhere in the world. Or every Texas data center, including small colocation sites, would have to consume 335,616 gallons per day on average — comparable to a 100 MW hyperscale facility. Or Texas alone would have to consume 2.8 times more water than every data center in the entire United States consumed in 2023, when LBNL and EPA pegged total U.S. data center direct water consumption at 17.4 billion gallons. None of those are physically plausible.
Texas Water Use, Category by Category
Here is the framework that should be applied to every “billions of gallons” headline: compared to what? The Texas Water Development Board’s 2023 Statewide Water Use Estimates, finalized in August 2025, put total Texas water use at 15.0 million acre-feet, or about 4,888 billion gallons. That is the denominator. Now run the categories.
Agricultural irrigation: 2,411 billion gallons (49% of state)
Texas farmers used 7.4 million acre-feet for irrigation in 2023, the largest single use category in the state. That is roughly 2.4 trillion gallons annually, or about 6.6 billion gallons every single day. Most of it is groundwater, drawn primarily from the Ogallala and other aquifers in the High Plains, with the Edwards-Trinity and Gulf Coast also significant. The 49B data center claim represents 2.0% of agricultural irrigation. The verified bottoms-up estimate represents 1.2%. If you turned off every data center in Texas tomorrow and the freed-up water flowed entirely to agricultural use, it would expand Texas farming output by roughly 1%. Worth noting: a substantial share of High Plains irrigation grows cotton, corn for ethanol, and feed crops for livestock — not food directly consumed by humans. The water-efficiency conversation around agriculture is real, important, and almost entirely absent from the data center coverage.
Municipal water: 1,694 billion gallons (35% of state)
The TWDB “municipal” category is broader than most people realize. It includes all water delivered through public water systems — residential, commercial, institutional, and a significant chunk of landscape irrigation served by city systems. At 5.2 million acre-feet, this category is 1,694 billion gallons annually. The 49B claim represents 2.9% of municipal water. The modeled actual is 1.7%. Even at the inflated number, every data center in Texas combined uses less water than the citizens of Houston and Dallas alone.
Residential indoor + outdoor: ~1,065 billion gallons
Take 31.7 million Texans (Texas Demographic Center Vintage 2024 estimate for 2025) at a conservative 92 gallons per person per day, and Texas residential water use lands at roughly 1,065 billion gallons per year. That is a low-end estimate; TWDB’s own “Grass Is Always Greener” study found averages of 172 gallons per person per day across 18 Texas study cities, which would push the figure closer to 2,000 billion gallons. The 49B claim represents 4.6% of residential. The modeled actual is 2.6%. Texas residents flush toilets, take showers, run dishwashers, and water plants at a volume that makes the entire state’s data center water use look like a rounding error.
Residential outdoor (lawns, gardens, pools): ~330 billion gallons
This is the part that is personal. TWDB Technical Note 12-012 — same agency, same dataset — establishes that 31% of single-family residential water use is outdoor: lawn watering, landscape irrigation, swimming pools, washing cars in driveways, the occasional Sunday-afternoon hosing-down of an already-clean sidewalk. Apply that 31% share to total residential, and Texas homeowners pour roughly 330 billion gallons per year onto their grass and shrubs.
The 49B claim represents 14.8% of residential outdoor watering. The modeled actual is 8.5%. Read that again. The “scary” data center number — the inflated, walked-back, media-amplified number — is less than one-seventh of what Texans collectively spray on their lawns. The realistic number is less than one-twelfth. If you live in Dallas, Houston, San Antonio, Austin, Fort Worth, or any suburb thereof, your neighborhood almost certainly uses more water on Bermuda grass than a mid-sized data center does on cooling. Nobody is panicked about it because it is familiar, distributed, and politically untouchable. It is just lawn.
Statewide landscape irrigation (single-family + multi-family + commercial + golf): ~619 billion gallons
The Texas Water Resources Institute at Texas A&M (publication em-116) estimates total statewide landscape irrigation — single-family, multi-family, commercial properties, parks, and golf courses — at 1,898,000 acre-feet, or roughly 619 billion gallons per year. The 49B claim represents 7.9% of landscape irrigation. The modeled actual is 4.5%. Texas waters its grass, broadly defined, with twelve to twenty-two times more water than every data center in the state uses for cooling.
Steam-electric power generation: 195 billion gallons
Conventional thermoelectric power plants — gas, coal, nuclear — withdraw and consume water for steam cycles and cooling. TWDB’s 2023 estimate puts steam-electric power use at 600,000 acre-feet, or about 195 billion gallons per year. (That is total use; consumption is a fraction, since much of it is once-through cooling that returns to the source.) The 49B claim represents 25.1% of power-generation water; the modeled actual including indirect is 14.8%.
The framing trap here is subtle. Critics often argue that data centers should be charged with the indirect water consumption of the power plants supplying them. Fine — but if you do that, you have to charge every electricity consumer with a proportional share. Residential and commercial users in Texas consume more electricity than data centers do. By the indirect-water logic, every air conditioner in Houston is also using thermoelectric power-gen water. The honest accounting is to compare like with like — direct cooling water against direct cooling water across categories. By that measure, data centers are a small fraction of power-generation water, and they are getting smaller as the grid mix shifts toward wind and solar (which use essentially no water) and as more campuses move to closed-loop cooling.
Manufacturing: 391 billion gallons
Texas manufacturing — refineries, chemicals, petrochemicals, semiconductors, food processing — used 1.2 million acre-feet, or about 391 billion gallons in 2023. The 49B data center claim is 12.5% of this; the modeled actual is 7%. A single semiconductor fabrication facility can use 10 million gallons of ultrapure water per day (per the World Economic Forum), and Texas has multiple under construction. We do not run “thirsty fabs” panic stories.
Mining (oil and gas operations): 98 billion gallons
Texas mining water use was 300,000 acre-feet, or roughly 98 billion gallons in 2023. The vast majority is oil and gas operations, particularly hydraulic fracturing. The Permian Basin produces enormous volumes of produced water as a byproduct — water that comes up out of the ground with oil and gas, often saline, often hydrocarbon-contaminated. ExxonMobil reported recycling 87% of its produced water for fracking operations as of 2024, up from 64% in 2022. This is one of the under-told water stories in Texas: oil and gas, often the villain in environmental coverage, has dramatically improved water recycling, and produced water is now being explored as a feedstock for data center cooling, agricultural use, and aquifer recharge after treatment. Texas’ 2025 GOP resolution explicitly calls for AI data centers to prioritize recycled produced water over freshwater.
Livestock: 98 billion gallons
Texas livestock used 300,000 acre-feet. Cattle drink water, but they also eat alfalfa, hay, corn, and other crops grown with irrigation water — so the true water footprint of Texas beef is much larger if feed is included. The direct figure of 98 billion gallons puts data centers at 50% of livestock direct use under the inflated claim and 28% under the modeled estimate.
The water loss footnote: ~150 billion gallons
Nobody wants to talk about this one. Texas municipal water utilities report water loss — water pumped, treated, and pressurized that never reaches a billed customer because it leaks out of the pipes — at typical rates of 10 to 15% of total system input. TWDB’s water loss audit data suggests Texas utilities collectively lose somewhere on the order of 150 billion gallons per year to leaky infrastructure. That is three times the 49B claim. It is lost, treated, drinkable water — gone, with nothing to show for it. The Texas legislature passed a $20 billion water infrastructure package in 2025 partly to address this. Every dollar fixing a pipe saves more water than every dollar spent fighting a data center permit, by orders of magnitude.
Summary table: Texas water use, side by side
| Category | 2025 use (B gal) | 49B claim as % | Modeled 28B as % |
|---|---|---|---|
| Total Texas water use | 4,888 | 1.0% | 0.6% |
| Agricultural irrigation | 2,411 | 2.0% | 1.2% |
| Municipal (residential + commercial + institutional) | 1,694 | 2.9% | 1.7% |
| Total residential (indoor + outdoor) | 1,065 | 4.6% | 2.6% |
| Statewide landscape irrigation (lawns + golf + commercial) | 619 | 7.9% | 4.5% |
| Manufacturing | 391 | 12.5% | 7.2% |
| Residential outdoor only (lawns/pools/gardens) | 330 | 14.8% | 8.5% |
| Steam-electric power generation | 195 | 25.1% | 14.8% |
| Municipal water lost to pipe leaks (est.) | 150 | 32.7% | 18.7% |
| Mining (oil & gas, fracking) | 98 | 50.0% | 28.6% |
| Livestock | 98 | 50.0% | 28.6% |
Look at the pattern. Even using the inflated, walked-back 49B number, data centers in Texas are a smaller water consumer than agriculture, municipal, residential, manufacturing, lawns, leaky pipes, and a host of other categories. Using the verified 28B figure, the proportion drops further. And the proportion is about to drop a lot more — because the cooling architecture is changing.
The Cooling Architectures That End the Water Question
Most of what has been written about data center water use describes a category of facility that is already obsolete. The numbers cited — 1.8 liters per kWh, hyperscale facilities at 528,000 gallons per day, evaporative cooling towers losing 70 to 80% of withdrawn water to the atmosphere — describe data centers built on architectures the industry is actively walking away from. The replacement is not theoretical. It is being installed right now, in 2026, in major facilities across Texas and the country.
How traditional cooling works
A conventional data center generates heat from chips. The heat is removed by chilled air blowing across server racks. The chilled air is produced by chillers, which produce chilled water. The chilled water absorbs heat, then dumps it into the atmosphere via cooling towers. Cooling towers use evaporation as their primary heat-rejection mechanism — water sprays through the tower, partial evaporation cools the rest, and the cooled water cycles back. Every gallon evaporated has to be replaced with “make-up water” from the municipal supply. This is the architecture that produces the scary numbers. It is also the architecture that data center operators are abandoning as fast as they can build the replacement.
Direct-to-chip liquid cooling
The new architecture removes heat at the source — the chip itself. Microchannel cold plates sit directly on top of CPU and GPU packages, with coolant flowing through them. The coolant absorbs heat from the chip, carries it out of the building, dumps it via dry coolers (no evaporation) or radiative panels, and returns. The fluid loop is sealed.
Two key features. Closed-loop: the coolant in the loop is the same coolant, day after day, year after year. Initial fill, occasional minor top-ups for leaks. A facility using direct-to-chip cooling might use a few thousand gallons over its operational lifetime, not millions per day. Non-evaporative: heat rejection happens through air-cooled radiators or specialized dry coolers. No water leaves the system as vapor. The metaphor is exact — the difference between traditional evaporative cooling and direct-to-chip cooling is the difference between flooding a field and drip irrigation. Same crop, fraction of the water.
Single-phase liquid immersion — and the marketing-vs-deployment gap
The next step beyond direct-to-chip is immersion cooling, where servers are submerged in a tank of dielectric fluid — a non-conductive coolant that will not short-circuit electronics. There are two variants. Single-phase immersion keeps the fluid liquid throughout, pumping it through external heat exchangers; mineral or synthetic oils run roughly $50–$100 per gallon. Two-phase immersion uses an engineered fluorocarbon fluid that boils at the chip surface, with vapor rising to a condenser, condensing, and falling back as liquid. ZutaCore (HyperCool), Submer, GRC, LiquidStack, and Asperitas are the names you will see.
This is where the marketing and the engineering reality diverge. Nvidia does not endorse immersion cooling for its current Blackwell-generation GPUs. Per Nvidia’s stated reasoning (reported by Tom’s Hardware, August 2025), long-term reliability of components in dielectric fluids is uncertain, the company cannot warranty parts under those conditions, modern compute halls are not built for immersion deployment, and the supply chain is not ready. AMD and Intel have explored immersion partnerships, but none of the three major chip makers have certified mainline AI accelerators for production immersion deployment. Two-phase immersion has a fluid problem on top of that: 3M discontinued production of the engineered fluorocarbon fluids used in two-phase systems in 2025, citing PFAS environmental concerns. The remaining alternatives (Accelsius NeuCool and others) cost $500–$1,000 per gallon and are still scaling. This has effectively frozen mainstream two-phase adoption.
Where immersion actually runs in production: crypto mining (the first commercial use case at scale), specialized HPC clusters, edge AI deployments where dust or humidity make air cooling unworkable, and pilot deployments at hyperscalers. It is not yet the primary architecture for mainstream AI training or inference at the major operators. Direct-to-chip cold plates currently command roughly 47% of the liquid cooling market by installed base, and that is the architecture being built into 2026’s flagship facilities.
The honest read: direct-to-chip is the deployed answer for 2025–2027. Single-phase immersion is the deployed answer in the niches where its reliability profile and density advantage have matured. Two-phase immersion is real but working through chip-vendor certification, fluid supply chain, and operational maturity. For a community evaluating a data center proposal, the right question is which specific cooling architecture the operator will deploy. “Closed-loop direct-to-chip” or “single-phase immersion” are verifiable; “we are considering immersion in the future” is marketing.
The major operators are already there
This is not a five-year-out concept. It is what is being built today.
- Microsoft announced in December 2024 that all data centers designed from August 2024 forward use a closed-loop, zero-water-evaporation architecture. The first deployments are in Phoenix and Mt. Pleasant, Wisconsin, going live in 2026. By late 2027, this is standard across Microsoft. The company estimates the design avoids more than 125 million liters per year per data center compared to its previous architecture.
- Oracle announced in February 2026 that its new AI data centers in New Mexico, Michigan, Texas, and Wisconsin will use direct-to-chip, closed-loop, non-evaporative cooling. Filled once, recirculated continuously.
- Amazon Web Services reports a global average WUE of 0.19 L/kWh — a tenth of the industry-average 1.8 L/kWh — across its data center fleet. In partnership with Veolia, AWS is also deploying reclaimed water systems that displace freshwater in cooling.
- Google’s new air-cooled Texas data center used 10,000 gallons in all of 2024. For comparison, Google’s older Iowa facility used 1.3 billion gallons that same year. Same company, two architectures, five orders of magnitude difference.
- Meta completed buildings recently exhibiting WUE of 0.20 L/kWh — also nine times better than industry average.
- The Abilene, Texas campus — operated by Oracle on a Crusoe-developed site, the highest-profile early “Stargate” facility — uses closed-loop liquid cooling, with an initial fill of approximately 1 million gallons and periodic maintenance refills. Two of eight buildings are operational as of early 2026, with roughly 1.2 GW total capacity. The site experienced a multi-day outage in early 2026 when winter weather impacted parts of the liquid-cooling infrastructure, and a planned 600 MW expansion was canceled in March 2026 amid financing disputes and OpenAI’s shifting capacity strategy. Closed-loop systems are real and they work, but they are new operational territory; the reliability curve is being walked in real time. The water benefits are real; the operational maturity is still earning.
Closed-loop systems do not claim to violate thermodynamics. They claim to reject heat without using municipal water as the heat-transfer mechanism. They use air, dry coolers, or refrigerant cycles. The fact that energy is lost as low-grade heat into the atmosphere via convection and radiation is the point. The thermodynamic ledger balances; the water ledger does not have to.
What this means for the projections
HARC’s 2030 projection range — 29 to 161 billion gallons — has a 5.5x spread between the low and high estimates. The variable that drives that spread is cooling-technology adoption. If Texas data center capacity grows 4x by 2030 (roughly the consensus growth case) and the cooling fleet remains 100% legacy evaporative, you get the high end. If the growth is built using the direct-to-chip and closed-loop architectures that Microsoft, Oracle, AWS, Google, Meta, and OpenAI are all standardizing in 2026, you get the low end — and the low end actually overstates it, because the projection did not account for the retrofit pipeline on existing facilities. In the realistic case, where new builds (which dominate growth) deploy zero-water cooling and the worst legacy facilities are retired or retrofitted, Texas data center water consumption in 2030 could be roughly the same as 2025 — or lower — even as compute capacity quadruples. Read that again. The infrastructure that scares people is being built specifically to avoid the impacts that scare people.
How the Math Gets Distorted
If you have read this far, you have a reasonable question: how does a 25 billion gallon figure (which is itself comparable to one neighborhood’s lawn watering) become a 49 billion gallon figure that becomes a national panic about AI sucking dry the water table? A few mechanisms, mostly mundane.
The withdrawal-vs-consumption elision. Water withdrawn from a source and water consumed (not returned to the source) are very different quantities. Power plants withdraw enormous volumes of water for cooling but return most of it; consumption is a fraction. Data centers using cooling towers typically consume 70 to 80% of withdrawn water (it evaporates), but data centers using closed-loop cooling consume essentially none. Articles routinely quote withdrawal figures while comparing to consumption-based denominators, or vice versa, producing apples-to-oranges ratios.
The aggregation trap. “Texas data centers will use 49 billion gallons” sounds enormous because 49 billion is a large number. “Texas residents pour 330 billion gallons on their lawns” is rarely paired with it. Big numbers without comparison are scary by default; the comparison is what makes them informative.
The hyperscale outlier. A single 100 MW hyperscale facility consuming 528,000 gallons per day generates a clean, vivid statistic for a journalist. But Texas has roughly 400 data centers, the vast majority of which are colocation, enterprise, or edge facilities one-tenth that size or smaller. Multiplying the hyperscale outlier by the full fleet count produces an inflated number. The HARC walk-back from 49B to 25B is partly attributable to using a more realistic distribution of facility sizes.
The growth-projection trap. Projections like “data center water use will hit 399 billion gallons by 2030” assume cooling technology stays the same as growth happens. In an industry where the largest operators have committed to zero-water designs as the new standard, this is a structurally invalid assumption. Linear extrapolation from 2024 cooling architectures into 2030 capacity is the methodological equivalent of projecting horse-manure pile-up in 1900 to estimate New York City’s 1950 sanitation crisis.
The political economy. This is the uncomfortable part. There are people, organizations, and constituencies who benefit from data centers being framed as a threat. Some are sincere environmentalists worried about water in arid regions — a legitimate concern, especially for poorly-sited evaporative-cooled facilities in places like Phoenix. Some are local politicians whose districts did not get the data center and would prefer none of the neighboring counties did either. Some are competing land users — agriculture, residential developers, manufacturing — who do not want competition for water rights or grid capacity. Some are activist organizations whose business model depends on having a clear villain. Some are journalists writing in a media environment that rewards alarming headlines and punishes “actually it is complicated.” None of these motivations are illegitimate on their own. But they all tilt in the same direction, and they all benefit from inflated numbers that go uncorrected.
What Workable Policy Looks Like
The actual water issues with data centers are real, local, and addressable. They are not existential statewide. They are specific to (a) facility siting in already-stressed watersheds, (b) cooling architecture, and (c) coordination with regional water planners. A short list of policies that would actually work:
- Mandatory WUE disclosure. Make data centers publish their water usage effectiveness numbers, audited annually, the same way large industrial users disclose air emissions. This is already standard in the EU. It would let communities distinguish between an Oracle direct-to-chip facility (effective WUE near zero) and a legacy evaporative facility (1.8+ L/kWh) and price or permit accordingly. About half of operators globally do not currently track WUE. That is a fixable problem.
- Produced water as the default for cooling, where available. Texas has billions of gallons of produced water annually from oil and gas operations. After treatment, it is suitable for industrial cooling. Mandating its use (or pricing freshwater to discourage it) for new data centers near production basins would eliminate the freshwater question entirely in West Texas, the Permian, and the Eagle Ford.
- Reclaimed municipal wastewater for cooling. Most Texas cities have wastewater treatment plants whose effluent is currently discharged to streams. AWS’s partnership with Veolia at its Mississippi facility uses reclaimed water for cooling, displacing 83 million gallons per year of freshwater. Standard practice in arid regions and easily replicated.
- Regional water-stress overlays in interconnection planning. ERCOT is being asked to develop frameworks for managing the data center load wave. The Public Utility Commission and TWDB should similarly overlay water-stress maps onto siting decisions, so that new builds in the High Plains (where the Ogallala is being mined down) face different requirements than new builds in East Texas where rainfall is plentiful.
- Closed-loop incentives. A simple property-tax abatement structured around WUE thresholds — full abatement for WUE under 0.2 L/kWh, partial under 0.5, none above 1.0 — would economically tip every new build toward the cooling architectures that resolve the water issue.
- Water-loss accountability for utilities. Texas water utilities lose roughly 150 billion gallons per year to leaky pipes — three times the inflated data center claim, six times the actual modeled usage. The $20B water infrastructure investment passed in 2025 is a start. Per-utility loss reporting and reduction targets would do more for Texas water security than any data center moratorium.
Notice what is not on this list: bans, moratoria, headline-driven permit denials, blanket “no AI” zoning. None of those address the actual water question. They just relocate it (data centers built elsewhere with more water-intensive cooling) or solve nothing (the lawn sprinklers keep running either way).
The Integrated Systems Alternative — and SAVRN’s Architecture
There is a deeper conversation underneath all of this, which is what an actually-good data center looks like in 2030. The way SAVRN frames it: a data center is a thermodynamic engine. It takes electrical energy in and produces low-grade heat out. The water question is really a “what happens to the heat” question. If you reject heat via evaporation, you use water. If you reject heat via dry coolers, you do not. If you capture the heat and use it productively, you do not have a waste-heat problem at all — you have a resource.
SAVRN’s doctrine takes that seriously. A high-density, small-footprint AI campus generates concentrated, predictable heat. The Power module generates the electrons that run the campus on site rather than from a regulated utility grid, which removes the indirect-water exposure that comes with grid-supplied electricity in the first place. Compute is liquid-cooled at 140-plus kW per rack, eliminating the open-evaporation cooling tower from the architecture entirely. The Loop module is the closed-loop integration layer that captures the rejected heat and pushes it into productive downstream uses. Heat drives:
- Aquaculture systems that need warm, stable water temperatures for tilapia, shrimp, or RAS-based fish farming.
- Vertical farms that use the heat for greenhouse climate control, particularly in winter, while simultaneously offsetting the campus’s HVAC load.
- Waste-to-energy systems whose pyrolysis or anaerobic-digestion thermal cycles benefit from a predictable compute-driven heat input.
- Materials production — graphene synthesis benefits from precise thermal control; aerogel production has thermal characteristics that can be matched to compute waste-heat profiles.
The water question becomes nearly trivial when the cooling system is closed-loop and the heat is being used downstream. Better than trivial: an integrated system can produce a net water output. Aquaculture wastewater, rich in fish-derived nitrogen, gets used in hydroponic vertical farming, and the plants take up the nutrients while transpiring clean water back into the closed environment. Net water position becomes a function of the agricultural side of the operation, not the compute side.
This is not speculative. The component technologies all exist, are commercially deployed somewhere, and are improving fast. What is new is integrating them into a single business model where the data center is one node in a closed-loop industrial ecosystem rather than a standalone water-and-power consumer. The fear-marketing framework — “data centers are the problem” — assumes a static picture of what a data center is. The engineering reality is that data centers are becoming, by design, less and less of a water issue, and the most ambitious new builds are actively becoming positive contributors to local water and food systems. That is the SAVRN thesis. Not that the people raising water concerns are wrong to care — they are right to care. But the specific concern they are raising is largely solved, the numbers driving the panic are wrong, and the energy spent fighting AI infrastructure permits would be better spent fixing leaky pipes and over-watering lawns. Both of those problems are bigger, more durable, and far less politically interesting.
What to Do With This
If you are a community member: ask the operator for their committed WUE number, in writing, in their permit application. Ask whether the cooling is closed-loop or evaporative. Ask whether they are using produced water or reclaimed water. If the answers are bad, push back specifically. If the answers are good, the water concern is essentially handled.
If you are a county or city official: do not ban data centers. Do not permit them blindly either. Build a tiered approval framework keyed to cooling architecture and water source. Reward zero-water designs with faster permits and tax abatements. Make the legacy evaporative architecture economically uncompetitive in your jurisdiction.
If you are a journalist: when you see the next “data centers will use X billion gallons” headline, do three checks. One: is that withdrawal or consumption? Two: what cooling architecture is being assumed? Three: what is the comparable figure for agriculture, lawns, and leaky pipes in the same geography? If your story does not include the comparison, it is not informing — it is amplifying.
If you are a builder, a landowner, or an enterprise buyer: the intersection of compute, water, agriculture, and energy is wide open. The regulatory environment over the next five years will reward integrated solutions and punish standalone evaporative builds. Direct-to-chip cooling is now table stakes, not a differentiator. The differentiators are heat capture, on-site generation, water reuse loops, and integrating the data center into a larger industrial ecosystem. If you control land that may host a campus like that, the SAVRN land evaluation framework is the right next read, and the Infrastructure Assessment form is the front door.
Frequently Asked Questions
How much water do Texas data centers actually use in 2025?
Approximately 25 to 29 billion gallons total — direct on-site cooling plus indirect power-generation water — per HARC’s revised January 2026 report and SAVRN’s independent bottoms-up model. That is roughly 0.4 to 0.6% of total Texas water use. The widely-cited 49 billion gallon figure was a preliminary estimate from a HARC white paper leaked to the Austin Chronicle in July 2025, which HARC itself walked back to about half that figure six months later.
Why was the 49 billion gallon number so widely repeated if it was wrong?
It was published as a preliminary white paper in July 2025 by the Houston Advanced Research Center and amplified by Newsweek, Texas Monthly, Texas Scorecard, the Lincoln Institute of Land Policy, the San Antonio Express-News, and dozens of regional outlets without qualification. When HARC released its formal report in January 2026 revising the figure to roughly 25 billion gallons, almost none of the original outlets re-ran the headlines. Corrections rarely travel as far as the original alarm.
How does Texas data center water use compare to lawn irrigation?
Texas residents pour roughly 330 billion gallons of water per year onto their lawns, gardens, and pools — about 31% of total residential water use, per TWDB Technical Note 12-012. Even using the inflated 49B claim, data centers represent 14.8% of residential outdoor watering. Using the verified 28B figure, the number is 8.5%. Texas waters its lawns with seven to twelve times more water than every data center in the state uses for cooling.
Does closed-loop cooling really use almost no water?
Yes. A direct-to-chip closed-loop cooling system is filled once with coolant, recirculated continuously, and tops up only for leaks. Heat rejection happens through dry coolers or radiators that move heat to the air without evaporation. Microsoft’s December 2024 design uses zero water for evaporative cooling. Google’s new air-cooled Texas data center used 10,000 gallons in all of 2024, compared to 1.3 billion gallons at its older Iowa facility. AWS reports a global average WUE of 0.19 L/kWh, a tenth of the industry average. The thermodynamics balance; the water ledger does not have to.
What is water usage effectiveness (WUE)?
WUE is the industry-standard metric for data center water efficiency: liters of water consumed per kilowatt-hour of IT energy used. The industry average is 1.8 L/kWh per Lawrence Berkeley National Lab and the U.S. Department of Energy. Top hyperscalers operate at 0.15 to 0.30 L/kWh. The worst evaporative-cooled facilities in hot climates push 2.5+ L/kWh. Closed-loop, dry-cooled facilities approach zero. WUE disclosure should be a standard requirement of any new data center permit.
What is “produced water” and why does it matter?
Produced water is the saline, often hydrocarbon-contaminated water that comes up out of the ground with oil and gas during extraction. The Permian Basin generates billions of gallons of it annually. After treatment, it is suitable for industrial cooling, certain agricultural uses, and aquifer recharge. ExxonMobil reported recycling 87% of its produced water for fracking operations as of 2024. Texas’ 2025 GOP resolution explicitly calls for AI data centers to prioritize recycled produced water over freshwater. For a campus sited near a production basin, produced water can eliminate the freshwater question entirely.
How much water does a SAVRN AI campus consume?
Far less than a comparable hyperscale facility. SAVRN cools at 140-plus kW per rack with single-phase liquid immersion and closed-loop heat rejection, which avoids the open-evaporation water consumption that traditional hyperscale air-cooled facilities depend on. The campus uses water for sanitary load, periodic make-up to the cooling fluid system, and the closed-loop thermal recovery that pushes waste heat into aquaculture, vertical farming, and industrial output. The marginal draw against the regional water balance is small by design, and integrated downstream uses can produce a net positive water position.
Should a county ban data center development on water-use grounds?
No, and a ban does not solve the underlying issue. A tiered approval framework keyed to cooling architecture and water source is the workable answer. Reward zero-water closed-loop designs with faster permitting and tax abatement. Require disclosure of committed WUE numbers in permit applications. Mandate produced-water or reclaimed-water sourcing where available. Make legacy evaporative architecture economically uncompetitive locally. That is how a county converts the water concern from a moratorium debate into an engineering specification.
How much water do Texas water utilities lose to leaky pipes each year?
Approximately 150 billion gallons per year, based on TWDB water-loss audit data showing typical loss rates of 10 to 15% across municipal systems. That is three times the inflated 49B data center claim and six times the verified figure. The $20 billion water infrastructure package passed by the Texas legislature in 2025 begins to address this. Per-utility loss reporting and reduction targets would do more for Texas water security than any data center moratorium.
What sources back the numbers in this analysis?
Texas Water Development Board’s “Texas Water Use Estimates Summary for 2023” (Aug 2025); Houston Advanced Research Center’s formal “Texas Data Center Water Use” report (Jan 21, 2026); Lawrence Berkeley National Lab’s 2024 U.S. Data Center Energy Usage Report (Shehabi et al.); EIA’s Short-Term Energy Outlook (Sept 2024); ERCOT’s Dec 2025 System Planning Update; Texas Demographic Center Vintage 2024; TWDB Technical Note 12-012 (“The Grass Is Always Greener”); TWRI Texas A&M publication em-116; Microsoft Cloud Blog (Dec 9, 2024); Oracle Cloud Infrastructure blog (Feb 9, 2026); AWS, Google, and Meta sustainability reporting; Tom’s Hardware and Bloomberg reporting on liquid cooling deployments. Every input is traced to its primary source in the underlying SAVRN model file.
Sources & Citations
Every quantitative claim in this piece traces to a named, verified primary source. URLs verified at time of publication. The full audit-grade citation record, with claim-by-claim source mapping and “cite this article” snippets, is maintained on the dedicated SAVRN sources page for this piece.
Primary research cited in this the 49 billion gallon mirage brief
- Texas Water Development Board — State Water Plan. Texas Water Development Board statewide demand projections used as the bottoms-up validation anchor for the verified water model.
- LBNL — 2024 United States Data Center Energy Usage Report (Shehabi et al.). Lawrence Berkeley National Lab’s 2024 United States Data Center Energy Usage Report — the canonical federal study on data center energy and water intensity.
Supporting frameworks, regulators, and industry data
- Houston Advanced Research Center (HARC). Houston Advanced Research Center — independent research on Texas water use, climate, and infrastructure that contextualizes the verified water model.
- New York City Department of Environmental Protection — water consumption statistics. New York City municipal water consumption benchmarks used as a population-scale comparison anchor in the verified water model.