Tokens per watt per dollar is the 2026 AI stack metric that finally measures intelligence the way owners sell it. The figure fuses three numbers at once. It tracks how many tokens a system produces, how much power it burns, and how much capital it ties up. As a result, every other legacy metric collapses into a sub-component. Cost per GPU-hour ignores power. Power Usage Effectiveness ignores cost. Tokens per second ignores both. SAVRN treats the unified number as the operating gauge of the Intelligence Refinery, per NVIDIA’s AI factory framing of token economics.
The shift matters because AI workloads now define data center economics. Goldman Sachs Research projects data center power demand will rise roughly 165% by 2030. The Uptime Institute Global Data Center Survey 2024 pegs the industry average PUE at 1.56. Meanwhile, the IEA Electricity 2026 report flags AI as the fastest-growing electricity load class in the developed world. So an owner who optimizes for one variable in isolation will misprice the entire build. Tokens per watt per dollar makes that mistake measurable.
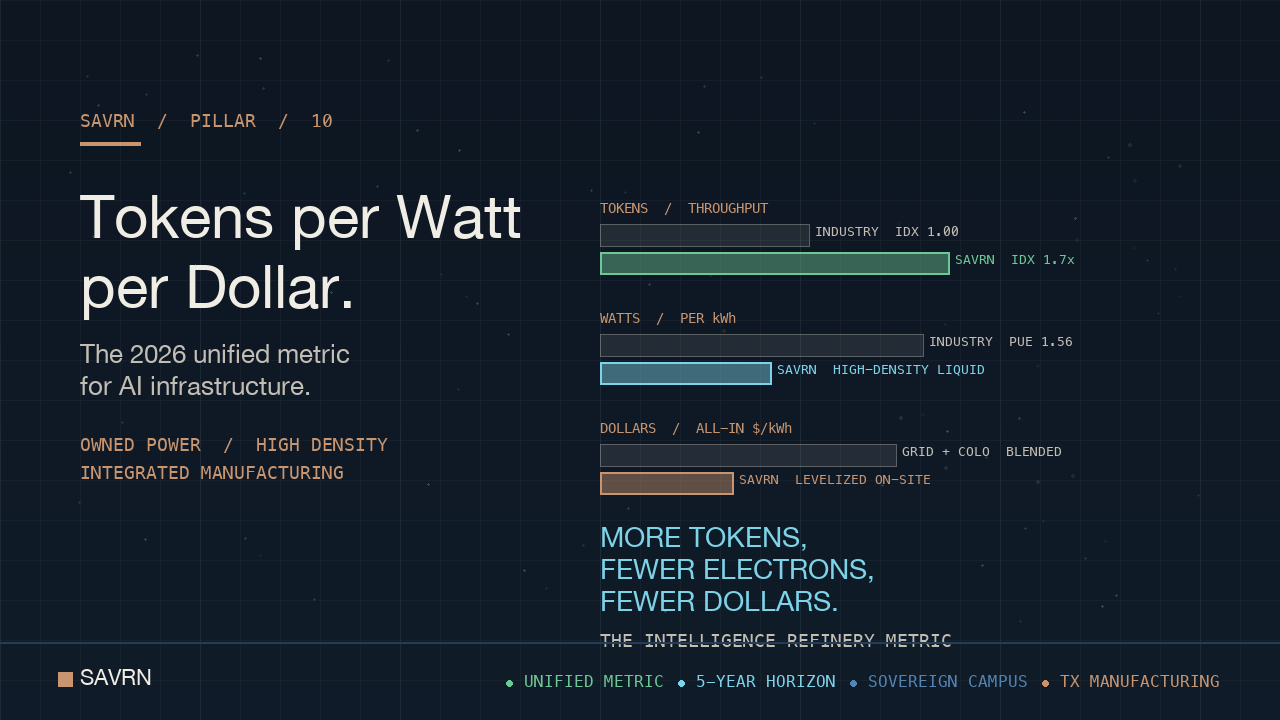
The takeaway up front. Cost per GPU-hour optimizes for the cloud vendor. PUE optimizes for the facility engineer. Tokens per second optimizes for the model researcher. By contrast, tokens per watt per dollar optimizes for the buyer who funds the entire stack. SAVRN designed its sovereign campus model around this number. In short, behind-the-meter power drives the watt term down. Also, domestic Intelliflex pod manufacturing drives the dollar term down. Finally, liquid cooling at high rack density drives the token term up. This guide walks through every component, the modeling math, and the 2026 to 2030 trajectory.
Why tokens per watt per dollar replaces every legacy AI metric
Three legacy metrics dominated the data center conversation through the cloud era. Cost per GPU-hour governed the cloud-procurement workflow. PUE governed the facility-design workflow. Tokens per second governed the model-research workflow. Each one optimizes for a single layer. So none of them describe the buyer’s actual cost of intelligence. Tokens per watt per dollar collapses the three into one operator-grade gauge.
Why cost-per-GPU-hour fails the tokens per watt per dollar test
Cost per GPU-hour is the cloud vendor’s preferred unit. It abstracts away the underlying power, cooling, depreciation, and overhead. As a result, two providers can quote identical hourly rates while running stack with different real costs. Also, the metric obscures the buyer’s true exposure when GPU prices reset. McKinsey’s 2024 generative AI capex outlook estimates roughly $250 billion in annual hyperscaler spend by 2027. That spend is buying capacity that will eventually need to amortize against output. Cost per GPU-hour cannot describe that payback arc.
The buyer eventually pays the real number. Therefore, every owner needs to measure that real number. Tokens per watt per dollar pulls the hidden cost of energy and capital back into the buyer’s view. Notably, this becomes essential the moment a workload moves from pilot to production utilization.
Why PUE alone misses the tokens per watt per dollar story
PUE remains a critical engineering lever. However, it cannot stand alone in the AI era. The Lawrence Berkeley National Laboratory 2024 United States Data Center Energy Usage report shows efficiency gains have flattened across hyperscale halls. Meanwhile, AI rack densities have surged past the design envelope of conventional air-cooled facilities. So the same PUE number can hide either world-class throughput or wasted compute. Without a token term, the metric tells only half the story.
An owner can post a 1.20 PUE while running idle GPUs. By contrast, another owner can post a 1.45 PUE while running fully utilized serving at extreme density. The second owner delivers more intelligence per electron. Therefore, PUE in isolation is a misleading buying signal in 2026.
Why tokens per second misses the tokens per watt per dollar lens
Tokens per second is the model researcher’s metric. It governs benchmark leaderboards, latency-sensitive inference, and serving SLAs. However, tokens per second contains no economic information. A high throughput number on a poorly utilized cluster does not translate into a low cost per query. Likewise, tokens per second on a high-PUE facility hides a power bill the buyer eventually settles. So the unit is a research tool, not a procurement metric.
How the unified metric resolves the three blind spots
The unified metric ties the throughput numerator to the two cost denominators that matter. As a result, an owner can no longer paper over inefficiencies in one layer with strength in another. The Deloitte 2026 Tech Trends report flagged tokens-per-watt as the emerging AI stack unit. SAVRN’s Intelligence Refinery doctrine extends that logic by adding the dollar term. In short, electrons turn into compute, compute turns into intelligence, and intelligence turns into tokens. Every link in that chain is a real expense.
The math behind tokens per watt per dollar
The formula is simple to state. Complexity sits inside each input. Useful tokens generated across the measurement period sit in the numerator. Total kilowatt-hours consumed times the fully-loaded dollar cost per kilowatt-hour sit in the denominator. That cost figure also includes an spread capital overhead per kilowatt-hour. Put differently, an owner must know the throughput, the energy bill, and the capex rent on the asset.
Defining the token numerator for tokens per watt per dollar
The token term must reflect useful tokens, not raw throughput. Speculative decoding, batch inference, and warm caching all distort the count. Therefore, the owner should pick a workload-stable definition. For training, the count usually maps to processed tokens at convergence. For inference, the count usually maps to served tokens at the buyer’s quality threshold. SAVRN audits both numerators against the EPRI 2024 Powering Intelligence whitepaper benchmarks for AI workload characterization.
The numerator also depends on hardware utilization. A 70% utilized GPU produces a different token rate than the same GPU at 30%. So the throughput number must be paired with a measured uptime figure for the metric to remain honest.
Defining the watt term inside the metric
The watt term must include facility-level draw, not just chassis draw. PUE multiplies through here. In short, an owner records GPU watts, multiplies by PUE, and converts to kilowatt-hours over the measurement window. Also, source of power matters too. Behind-the-meter power often delivers a different effective rate than grid-tied supply. As a result, two facilities with identical PUE can post different effective watt terms.
Defining the dollar term inside the metric
The dollar term carries the most variance across operators. Energy cost per kilowatt-hour is the first input. Amortized capex per kilowatt-hour is the second. Operations overhead per kilowatt-hour is the third. Public-cloud buyers can simplify by using the blended GPU-hour rate. By contrast, owned-campus owners model the full stack. Power and cooling capex flow into a single per-kilowatt-hour number. So do rack capex, GPU capex, and ops payroll. So the build vs buy comparison becomes apples to apples.
A worked example for the unified metric
Consider an serving workload running on liquid-cooled racks at high density. Assume the workload generates 10 million served tokens per hour. Facility-level draw runs 400 kilowatts at 1.10 PUE. The fully-loaded effective cost lands at 8 cents per kilowatt-hour, including capex amortization. The metric resolves as 10 million tokens divided by 440 kilowatt-hours times 8 cents. That equals roughly 284,000 tokens per dollar. The buyer can now compare that figure directly against any cloud, colocation, or sovereign quote.
The watt component: PUE, rack density, and the cooling floor
The watt term is the leverage point most owners misjudge. It looks like a facility-engineering problem. In reality, it is a product-architecture problem. Therefore, the cooling, rack-density, and waste-heat choices set the watt floor. They lock that floor for the next ten years.
Why air cooling caps tokens per watt per dollar gains
Air cooling fails as the dominant heat-rejection mode at the rack densities required for modern AI workloads. The IEEE Spectrum 2025 cooling-architecture analysis traces the inflection. In short, conventional air halls top out near 30 to 60 kilowatts per rack. Modern AI racks routinely exceed that envelope. So air-cooled facilities either undersubscribe their racks or oversubscribe their cooling. Both outcomes raise the watt term.
Liquid cooling rewrites the floor. Direct-to-chip and immersion designs support rack-level power and cooling sized for high-density AI workloads. Also, liquid handles waste heat at temperatures useful for downstream recovery. As a result, the same kilowatt of input power produces more usable compute and more recoverable thermal energy.
How rack density shapes the metric
Rack density compounds the entire metric. A higher-density rack delivers more GPUs per square foot. Also, it shrinks the network distance between accelerators. So training and serving latency drop. SAVRN’s Intelliflex pods host high-density configurations sized for NVIDIA’s enterprise AI factory roadmap. The design supports the next-generation rack densities NVIDIA has telegraphed without forcing the owner to retrofit cooling.
Why behind-the-meter generation lifts tokens per watt per dollar
Behind-the-meter power is the most underrated lever inside the watt term. It bypasses utility transmission costs. It also bypasses the grid grid hookup backlog flagged in the RMI 2025 grid-queue analysis. As a result, a behind-the-meter owner delivers electrons at a known rate. Grid-tied competitors wait years longer for the same. SAVRN’s sovereign campus model is engineered around this lever.
The savings compound across the watt term. A lower effective electricity rate flows directly into the dollar denominator. Also, the avoided grid hookup delay shortens the path to revenue. Both effects raise the tokens per watt per dollar score before a single GPU lights up.
Closed-loop water and the watt term
Closed-loop liquid cooling eliminates the make-up water requirement that haunts evaporative-cooled hyperscale halls. Therefore, the owner avoids both the regulatory exposure and the variable cost of water consumption. SAVRN’s 49 billion gallon water analysis documents the bottoms-up Texas math behind that decision. In short, water risk and watt risk are coupled. A campus that solves one almost always solves the other.
The dollar component: capex amortization, energy cost, and operations
The dollar term hides three distinct line items. Capex amortization. Energy cost. Operations overhead. Each one moves independently. So the buyer must instrument each one to get a defensible the unified metric number.
How capex amortization enters the metric
Capex payback converts a multi-million-dollar build into a per-kilowatt-hour rent on the asset. The owner picks an payback horizon. Most owned-campus models use a 5-year horizon for compute. The facility shell typically uses a 10 to 15-year horizon. Also, the model must include power power capex when the campus owns its electrons. As a result, the per-kilowatt-hour figure stops being just the wholesale electricity rate. It becomes the all-in cost of the entire delivery chain.
Why energy price volatility shapes the dollar term
Grid-tied owners face energy price volatility every billing cycle. The IEA 2026 Electricity report documents the rise of AI-driven demand on regional grids. So wholesale prices have started to spike during AI training windows. By contrast, behind-the-meter power locks the effective rate. The owner pays the levelized cost of the asset, not the spot price of the grid. Therefore, the this metric score becomes more stable across the payback horizon.
The hidden ops costs that distort the score
Operations overhead carries the most under-modeled costs. It includes payroll for site engineers, software for orchestration, replacement components, and downtime reserves. Also, security ops centers, network ops centers, and physical security all draw against the dollar term. So a sovereign campus bundles these layers into one operating model. That bundled model often beats a fragmented stack on the metric. SAVRN’s Intelligence Refinery operates this way by design.
Why deployment speed compounds tokens per watt per dollar
A campus that ships in 6 to 12 months earns revenue much sooner. The lead is 18 to 36 months over a 24-to-48-month build. The earlier revenue improves the dollar term across the full payback horizon. Also, the earlier rollout means the GPUs depreciate against more billable hours. So rollout speed is a the metric input. SAVRN’s AI stack rollout timeline codifies the phase-by-phase compression that makes that math work.
The token component: utilization, model size, and inference economics
The token term decides the numerator. It is the easiest to overlook because most owners assume the model dictates throughput. However, stack choices around uptime and batching matter just as much. They often double the realized token rate at the same hardware spend.
Why sustained utilization defines tokens per watt per dollar
Sustained uptime is the single most powerful lever on the token term. A GPU at 80% uptime produces roughly twice the tokens of the same GPU at 40%, with marginal additional power. So the per-token cost falls. Also, sustained uptime is easier to achieve when an owner owns the workload pipeline. By contrast, a public cloud buyer rarely controls scheduling well enough to hold high uptime for months at a time.
How model size warps the score
Larger models burn more compute per token. Smaller models burn less. As a result, the operator’s model strategy directly moves the metric. A buyer running distilled models on the same hardware posts a higher token rate. Flagship-scale models burn more compute per token. Therefore, the efficiency number must be reported alongside the model class to remain meaningful.
Inference batching and the token term
Continuous batching, paged attention, and speculative decoding all compress the per-token cost. The vLLM and TensorRT-LLM communities have published broad benchmarks documenting the 2x to 5x throughput gains from these techniques. So an owner with a sophisticated serving stack will post a higher the operator-grade gauge score than one running naive batching. The stack does not change. The token term improves anyway.
Why dual-revenue workloads protect the score
Idle GPUs destroy the token term. They consume capex payback without producing useful tokens. SAVRN’s circular-economy doctrine pairs AI compute with bitcoin mining ASICs and waste-heat recovery. As a result, idle AI capacity reroutes to mining workloads. Those workloads produce revenue against the same power and cooling budget. Also, waste heat enters downstream uses. So the campus posts a higher effective the unified efficiency number number even when AI uptime dips.
How SAVRN’s sovereign campus wins tokens per watt per dollar
SAVRN designed the sovereign campus model around the unified metric. Every architectural choice maps to one of the three terms. Behind-the-meter power drives down the watt cost. Domestic Intelliflex manufacturing drives down the dollar cost. Liquid cooling at high density drives up the token throughput. Notably, no individual choice is unique to SAVRN. The integration of all three under one owner stack is.
Behind-the-meter power and tokens per watt per dollar
Behind-the-meter power removes the largest source of dollar-term volatility. The owner pays the levelized cost of the on-site plant. By contrast, the grid-tied owner pays the regional wholesale rate plus transmission and ancillary services. As a result, SAVRN’s effective dollar term sits below the grid-tied baseline across the 5-year payback horizon. Also, the avoided grid hookup delay accelerates first revenue.
Intelliflex manufacturing and the dollar term
Intelliflex is integral to SAVRN, not a third-party vendor. The Fort Worth, Texas factory builds the modular pods that deploy on a SAVRN site. So the supply chain compresses from 12 to 18 months down to a controllable production cadence. Also, integrated manufacturing eliminates the broker-mark-up that grows the dollar term in fragmented stacks. The Customer Experience Center in Fort Worth lets buyers walk through a deployable pod before the contract closes.
Liquid cooling and the token term
Liquid cooling at high density raises the token throughput per square foot. Also, it lowers the watt cost of heat rejection. As a result, the same input power produces more useful tokens. The combined lift on the numerator and denominator is the largest single the tokens-per-dollar score lever inside the SAVRN architecture. The Lawrence Berkeley National Laboratory analysis of cooling-system efficiency at AI rack densities confirms the directional gain.
Sovereignty and the strategic premium on tokens per watt per dollar
Sovereign workloads carry a quality premium that public-cloud delivery cannot match. In short, regulated industries, defense buyers, and sovereign nations all require sole-tenancy, air-gap, and supply-chain visibility. As a result, the buyer is willing to pay more per token for sovereignty. Therefore, SAVRN’s the tokens-per-dollar number score rises on the dollar-of-revenue side of the equation, not just the cost side. The SAVRN sovereign AI infrastructure doctrine codifies that revenue model.
The 6 to 12-month deployment compression
SAVRN deploys in 6 to 12 months versus the industry standard of 24 to 48. So every dollar of capex starts producing tokens 18 to 36 months earlier. That earlier ignition compounds across the payback horizon. Also, it lets buyers respond to model and workload shifts before the cycle moves past them. In short, rollout speed is a this efficiency score variable, not a marketing slogan.
How to model tokens per watt per dollar for your own deployment
Every buyer can build a defensible the score number. The discipline is procedural. In short, the buyer instruments each term, locks the payback horizon, and runs sensitivity tests on the inputs that move the most.
Step 1: instrument the token term
Pick the workload definition first. Training runs require a converged-token count. Inference runs require a served-token count at the buyer’s quality threshold. Also, log the realized utilization, not the nameplate. As a result, the numerator reflects production reality rather than benchmark optics. Most owners discover the token term sits 30% to 50% below their assumed value during this step alone.
Step 2: instrument the watt term
Measure facility-level draw. Multiply chassis draw by realized PUE, not design PUE. Then layer in cooling auxiliaries, network gear, and lighting. So the watt term ends up roughly 8% to 25% higher than the chassis nameplate suggests. The Uptime Institute survey data confirms the typical gap. The buyer who skips this step understates costs and overstates the metric.
Step 3: instrument the dollar term
Calculate the all-in cost per kilowatt-hour. Include energy cost, capex amortization, and ops overhead. For owned-campus models, layer in the levelized cost of the on-site power plant. For cloud and colocation models, derive an implied effective rate from the contract pricing. So the dollar term lets the buyer compare buy and build options on equal footing.
Step 4: stress-test the metric with sensitivities
Run the metric across realistic sensitivity bands. Vary energy price by plus or minus 30%. Then sweep realized uptime by plus or minus 20 percentage points. Also vary model class across the operator’s portfolio. As a result, the buyer learns which inputs dominate the score. In most owned-campus models, energy price and uptime carry roughly two-thirds of the variance. Therefore, the operator’s procurement and scheduling decisions matter as much as the upfront design.
Step 5: report the metric alongside its inputs
The metric needs context. Therefore, every reported figure should arrive paired with the workload definition, the model class, the realized utilization, and the payback horizon. Also, the buyer should publish the assumed energy price and PUE. So two owners can compare numbers without arguing about hidden assumptions. Transparency turns the metric into a procurement standard rather than a marketing claim.
The 2026 to 2030 trajectory for tokens per watt per dollar
The metric will steepen. Three forces drive the curve. First, AI workloads will keep growing while grid capacity will not. Second, hardware efficiency will keep improving. Third, sovereignty-grade procurement specifications will harden. Together, these forces will force every owner to publish a the unified number number whether they want to or not.
AI demand outpaces the grid
Goldman Sachs Research projects roughly 165% growth in data center power demand by 2030. The RMI 2025 grid-queue analysis flags grid hookup waits exceeding five years across major North American markets. So the buyers who control on-site power will post lower watt-term costs while their grid-tied competitors absorb the shortage premium. The metric will reward sovereign campus owners directly.
Hardware roadmaps lift the token term
NVIDIA’s enterprise AI factory roadmap continues to push performance per watt upward. The next-generation rack densities NVIDIA has telegraphed will raise the token throughput per kilowatt by meaningful margins. Also, software stacks like vLLM and TensorRT-LLM will keep extracting more tokens from the same silicon. So the token numerator will keep rising even as power becomes scarcer.
Procurement will demand efficiency disclosures
Sovereign procurement frameworks have started to specify stack efficiency metrics. The U.S. Department of Defense’s 2026 AI strategy and the IBM Sovereign Core productization both signal a procurement-grade demand for measurable stack efficiency. As a result, vendors that cannot publish a defensible the owner gauge number will fall out of consideration for the highest-value contracts. The metric becomes a gating filter, not just a reporting line.
Where SAVRN’s Intelligence Refinery sits in the trajectory
SAVRN built the Intelligence Refinery doctrine for this exact decade. In short, the campus owns the electrons, the compute, and the cooling. Also, it manufactures its own pods through Intelliflex. As a result, every variable inside the metric sits inside the operator’s control. The SAVRN Intelligence Refinery framing positions the entire campus as a token-producing asset rather than a real-estate play. That is the architectural prerequisite for winning the unified gauge through 2030.
The strategic message for buyers
Buyers should adopt the metric now, not in 2028. First, model the existing fleet against the unified number. Second, use the result to evaluate the next capex cycle. Third, demand vendor disclosures in the same units. So the buyer wins on procurement leverage, stack planning, and board-level reporting. The Intelliflex integrated manufacturing path delivers the assets that score well against the metric, on the rollout clock the metric rewards.
Frequently asked questions about tokens per watt per dollar
What is tokens per watt per dollar?
this measurement is a unified AI stack efficiency metric that fuses throughput, power, and capital into a single number. It measures how many useful tokens a system produces per unit of power consumed and per dollar of all-in cost. NVIDIA’s 2025 token-economics framing introduced the throughput-per-watt unit. Deloitte’s 2026 Tech Trends report flagged the metric as the emerging owner standard. SAVRN extends the framing by including capex payback and ops overhead, which produces a buyer-grade gauge of intelligence cost.
Why is cost per GPU-hour not enough?
Cost per GPU-hour ignores the underlying power, cooling, depreciation, and overhead behind that hour. As a result, two providers can quote identical hourly rates while running stack with very different real costs. McKinsey’s 2024 generative AI capex outlook estimates roughly $250 billion in annual hyperscaler spend by 2027, capacity that must amortize against output. Cost per GPU-hour cannot describe that payback arc. The buyer eventually pays the real number, so the buyer must measure the real number.
How does PUE fit inside the metric?
PUE multiplies through the watt term. The owner records GPU watts, multiplies by realized PUE, and converts to kilowatt-hours over the measurement window. The Uptime Institute Global Data Center Survey 2024 pegs the industry average PUE at 1.56. Liquid-cooled high-density facilities can post substantially better numbers, which lowers the watt term. However, PUE in isolation is misleading. A facility can post a great PUE while running idle GPUs, which destroys the token numerator and the overall metric.
How is the metric calculated?
Take total useful tokens generated across a measurement period as the numerator. Multiply facility-level kilowatt-hours by the all-in dollar cost per kilowatt-hour as the denominator. The all-in dollar term includes energy cost, spread capex, and ops overhead. The result is tokens per dollar of fully-loaded stack spend. SAVRN audits both the numerator and the denominator against the EPRI 2024 Powering Intelligence whitepaper benchmarks for AI workload characterization, which keeps the comparison defensible across operators.
What inputs move the metric the most?
Realized uptime and effective energy price typically carry roughly two-thirds of the variance in owned-campus models. Model class also matters because larger models burn more compute per token. Inference batching technique can lift the token throughput by 2x to 5x without changing the hardware, per published vLLM and TensorRT-LLM benchmarks. So the operator’s scheduling, procurement, and serving stack decisions can shift the metric as much as the upfront design choices around cooling and power.
How does behind-the-meter power change the metric?
Behind-the-meter power locks the effective electricity rate at the levelized cost of the on-site plant. By contrast, grid-tied owners pay the regional wholesale rate plus transmission and ancillary services, which is increasingly volatile under AI demand growth. The IEA 2026 Electricity report documents AI-driven price spikes on regional grids. As a result, behind-the-meter campuses post a more stable and usually lower watt-term cost across the 5-year payback horizon, which lifts the unified metric.
Why does deployment speed influence the metric?
A campus that ships in 6 to 12 months earns revenue much sooner. The lead is 18 to 36 months over a 24-to-48-month build. The earlier revenue improves the dollar term across the payback horizon. Also, the GPUs depreciate against more billable hours, which raises the effective dollar return. So rollout speed is a direct input into the gauge. The phase-by-phase compression behind the SAVRN rollout timeline drives the gain at every stage of the build.
Is the metric only relevant to large operators?
No. Any AI workload running at sustained uptime benefits from the metric. Even a single-rack rollout can be measured. The discipline of instrumenting tokens, watts, and dollars produces actionable insight at any scale. Also, smaller owners often discover that their realized uptime or PUE differs sharply from their assumed value, which lets them improve the score with no hardware changes. The metric is a procurement and ops tool, not a hyperscaler-only construct.
How does sovereignty affect the metric?
Sovereign workloads carry a quality premium that public-cloud delivery cannot match. Regulated industries, defense buyers, and sovereign nations all require sole-tenancy, air-gap, and supply-chain visibility. As a result, the buyer is willing to pay more per token for sovereignty, which lifts the dollar-of-revenue side of the equation. SAVRN’s sovereign campus design captures that premium while also lowering cost, so the unified metric improves on both ends. The U.S. Department of Defense 2026 AI strategy formalizes the sovereign procurement spec.
What is SAVRN’s advantage on the metric?
SAVRN integrates behind-the-meter power, liquid cooling at high density, and Intelliflex domestic manufacturing under one owner stack. The combination drives the watt cost down, the dollar cost down, and the token throughput up at the same time. So the unified metric improves across all three terms rather than just one. Active SAVRN developments span California, Texas, Colorado, Nebraska, Panama, and Barbados. Each campus is engineered as a token-producing asset measured against the same operator-grade gauge.
Where can buyers see Intelliflex deployment in person?
Intelliflex operates a Customer Experience Center in Fort Worth, Texas. Buyers can walk through a deployable pod, inspect the integrated cooling and power, and review the manufacturing line that builds them. As a result, procurement teams can validate the design before signing the contract. SAVRN considers the experience center a core part of the buy-decision workflow because the metric only earns trust once the buyer can see the asset that produces it.
Sources & Citations
Every quantitative claim in this piece traces to a named, verified primary source. URLs verified at time of publication. The full audit-grade citation record, with claim-by-claim source mapping and “cite this article” snippets, is maintained on the dedicated SAVRN sources page for this piece.
Primary research cited in this tokens per watt per dollar brief
- NVIDIA — AI Factory blog. NVIDIA’s AI factory framing of token economics — the vendor framing that anchors the tokens-per-watt-per-dollar metric’s industry adoption.
- LBNL — 2024 United States Data Center Energy Usage Report. Lawrence Berkeley National Laboratory 2024 United States Data Center Energy Usage Report — canonical baseline for the energy denominator in tokens-per-watt-per-dollar.
Supporting frameworks, regulators, and industry data
- Uptime Institute Global Data Center Survey 2024. Uptime Institute Global Data Center Survey 2024 — rack density, PUE, and operator-side data backing the metric’s denominator components.
- Goldman Sachs Research — AI-poised-to-drive-160-increase-in-power-demand. Goldman Sachs Research projection on data center power demand growth driven by AI workloads.
- IEA — Electricity 2026. IEA Electricity 2026 report on global power demand from data centers and AI.
Continue exploring the SAVRN doctrine
- SAVRN sovereign AI infrastructure — the operator’s complete guide to off-grid, owned AI compute.
- From site to first token — SAVRN’s 6 to 12-month AI campus deployment timeline.
- Build vs buy AI infrastructure — the 2026 capex decision framework for sovereign campus ownership.
- Modular AI campus — why 6 to 12 months changes everything for AI infrastructure economics.
- The 49 billion gallon mirage — AI data center water consumption, verified and modeled.