Volume Beats Price
Token prices collapse at fixed capability, but posted prices fell only about 9 percent a year while volume grew several-fold. The one real risk is a fixed silicon generation losing pricing power.

The Empirical Case That AI Inference Demand Outruns Token Deflation, and the One Refinement That Makes the Model Bulletproof
The bear case against AI token demand rests on one number: the price of a token is collapsing, so revenue per unit of compute must collapse with it. This post makes the opposite case: AI token demand is growing faster than token prices are falling, and the bear case quotes the right number from the wrong measuring stick.
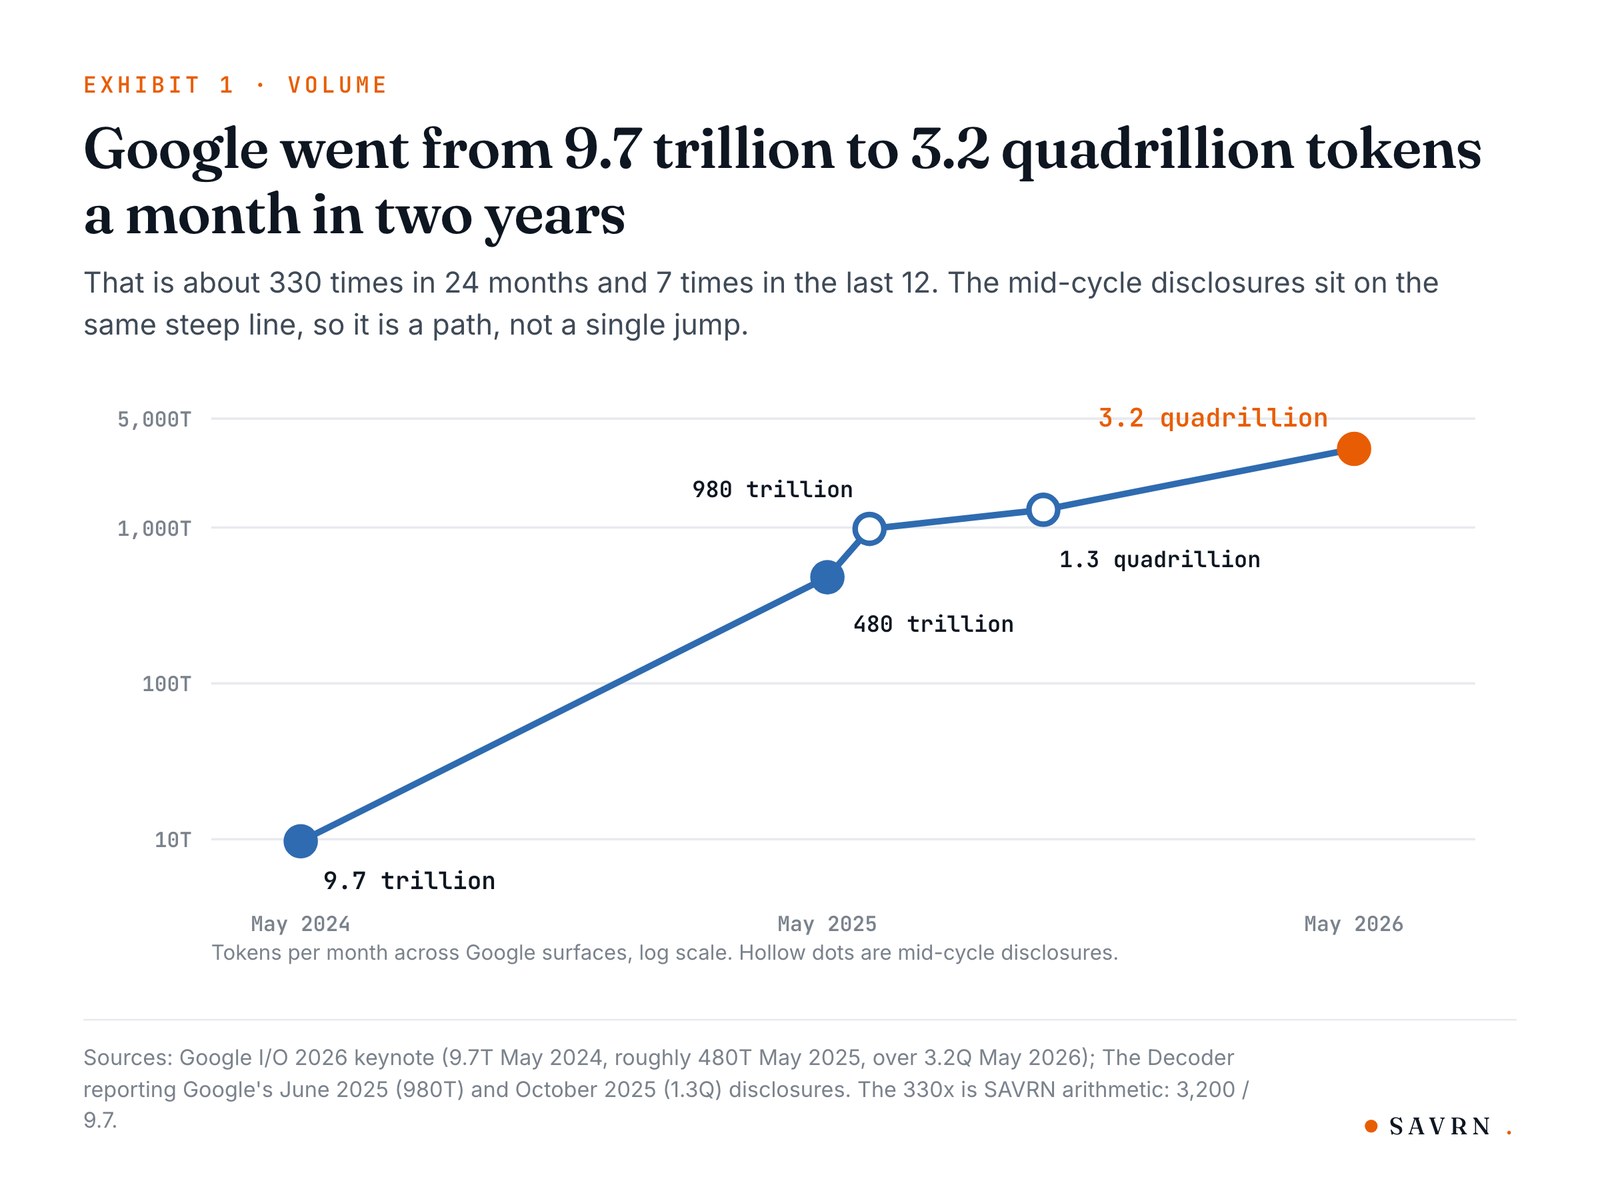
On the volume side, token processing is compounding rather than just growing, at rates that have broken every forecast I could find from the firms closest to the data. Google, for example, went from 9.7 trillion to over 3.2 quadrillion tokens a month in 24 months, roughly 330 times, and 7 times in the last 12.[1] Goldman Sachs projects more than 70 times growth in global token processing by 2030, while the observed run rate is already about double Goldman’s own estimate for May 2026.[2]
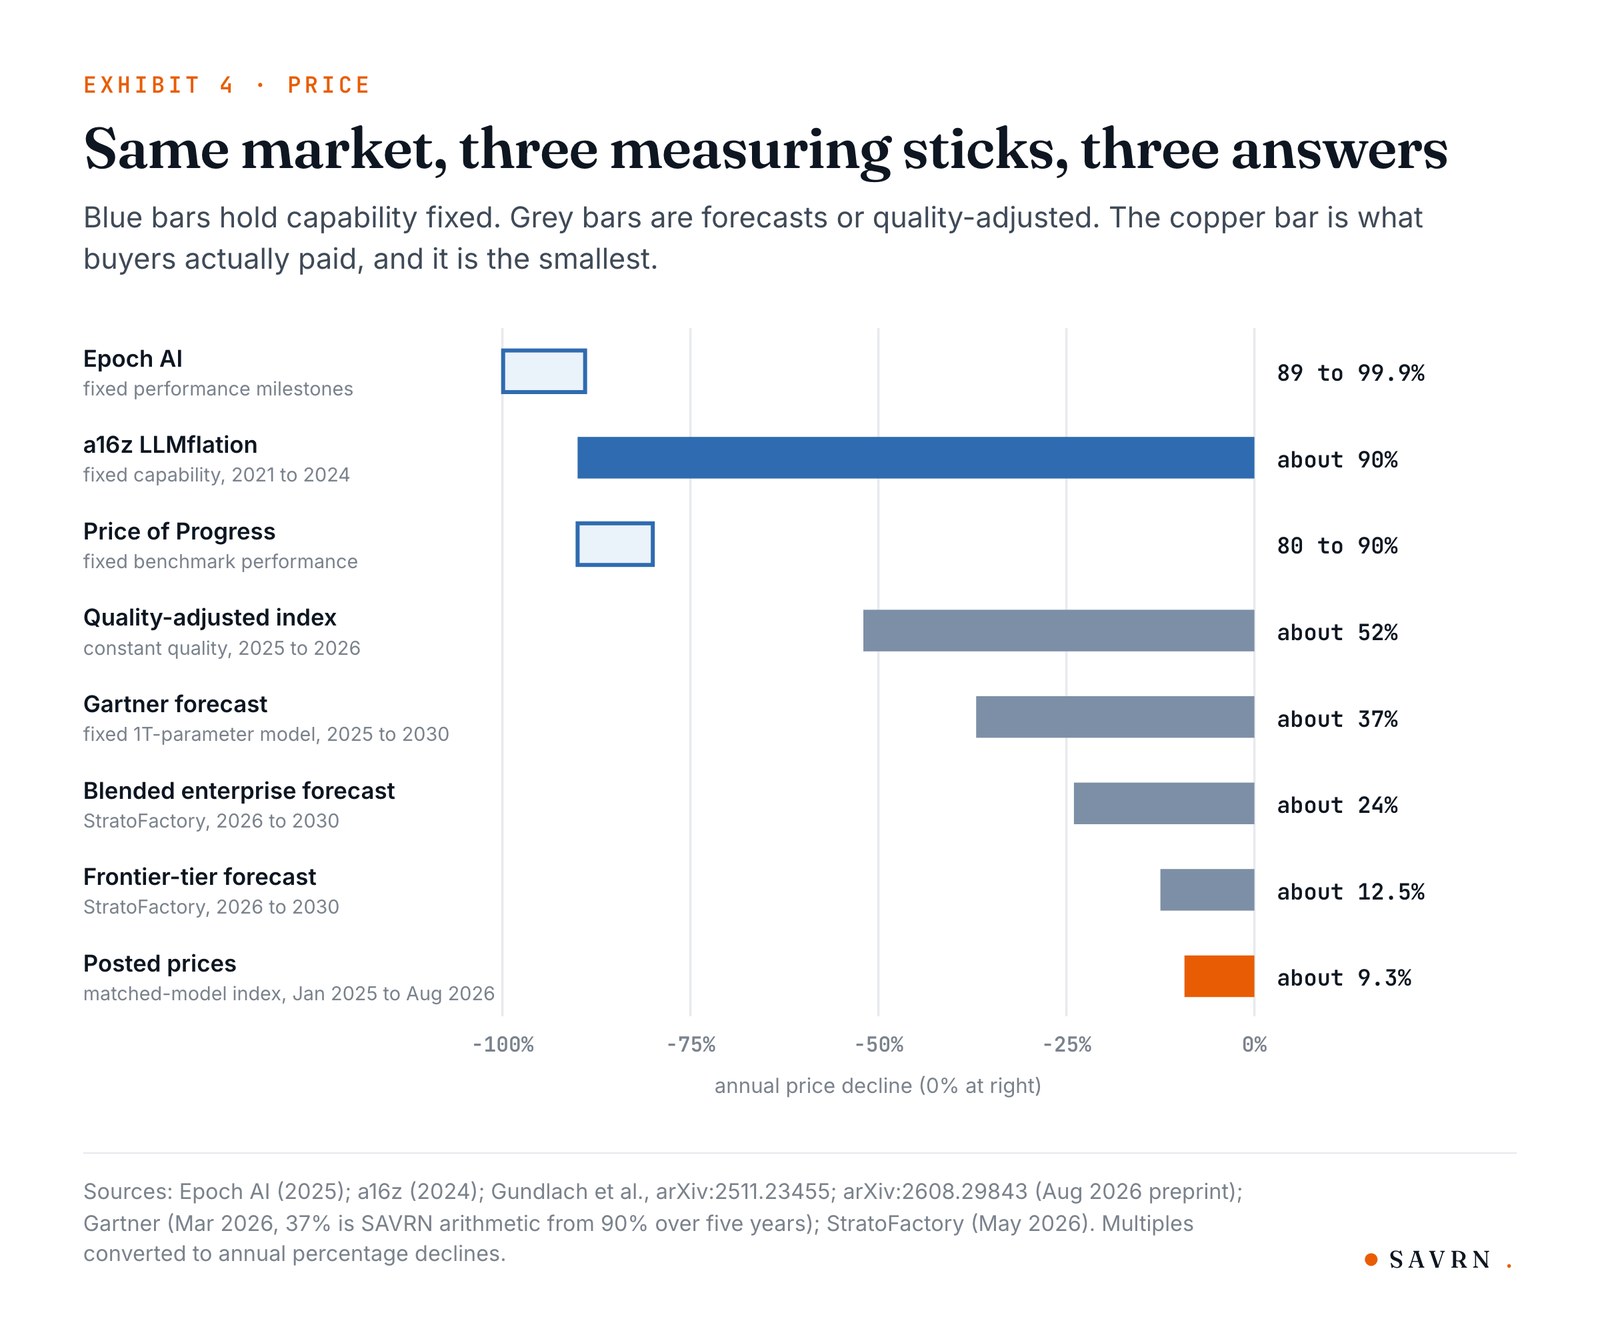
On the price side, the frightening deflation statistics are all measured at fixed capability, although no buyer actually buys fixed capability. a16z’s “LLMflation” finds about 10 times a year, while Epoch AI finds 9 to 900 times a year.[3, 4] A quality-adjusted price index preprint from August 2026 measured what posted prices did over 19 months, and the answer was about 9.3 percent a year, because a quality-upgrade wedge absorbs 87 percent of the capability deflation.[5] Volume times price, and volume wins: enterprise generative-AI spend rose 3.2 times in one year, from $11.5 billion in 2024 to $37 billion in 2025.[6]
The one genuine deflation risk is narrower, and it is physical: a fixed silicon generation loses pricing power, and demand growth does not fix that. Refresh does, and SemiAnalysis’s measured throughput per megawatt, 2.26 million then 6.95 million then 28.5 million then 59.4 million tokens per second from H200 to Vera Rubin, is ultimately why refresh pays.[7] The risk is fixed-silicon pricing power rather than demand destruction. Because accuracy matters more than confidence here, every figure below is dated and attributed, and my own arithmetic is labeled as mine.
1. The Demand Side: Observed Token Volume Is Compounding Faster Than Any Forecast
The observed record from platforms and hyperscalers
The most important property of the demand data is that it was observed, because it came from earnings calls, developer keynotes, and funding announcements rather than from models. Google’s series is the cleanest long-run one in the industry: 9.7 trillion tokens a month across its surfaces at I/O 2024, roughly 480 trillion at I/O 2025, and over 3.2 quadrillion at I/O 2026. That is a 7 times year-over-year jump, and about 330 times in two years, although the division is one I did myself.[1] The mid-cycle disclosures sit on the same line: about 980 trillion a month by June 2025 and 1.3 quadrillion by October 2025.[8] It is a path rather than a single jump.
The same compounding shows up everywhere volume is disclosed. Microsoft said it processed over 100 trillion tokens in its fiscal third quarter of 2025, up 5 times year over year, including a record 50 trillion in the last month of that quarter alone.[9] OpenAI’s API averaged about 8.6 trillion tokens a day in October 2025,[10] while Fireworks AI, an inference specialist, went from more than 10 trillion tokens a day in October 2025 to more than 40 trillion a day by July 2026, and crossed a $1 billion annualized revenue run rate.[11, 12, 13] OpenRouter’s weekly volume rose 5 times in six months, from 5 trillion to 25 trillion tokens, by May 2026.[14] In China, ByteDance disclosed that Doubao alone was consuming over 120 trillion tokens a day by April 2026, as relayed by CEIBS.[15] These are company-reported figures, and I treat them that way.
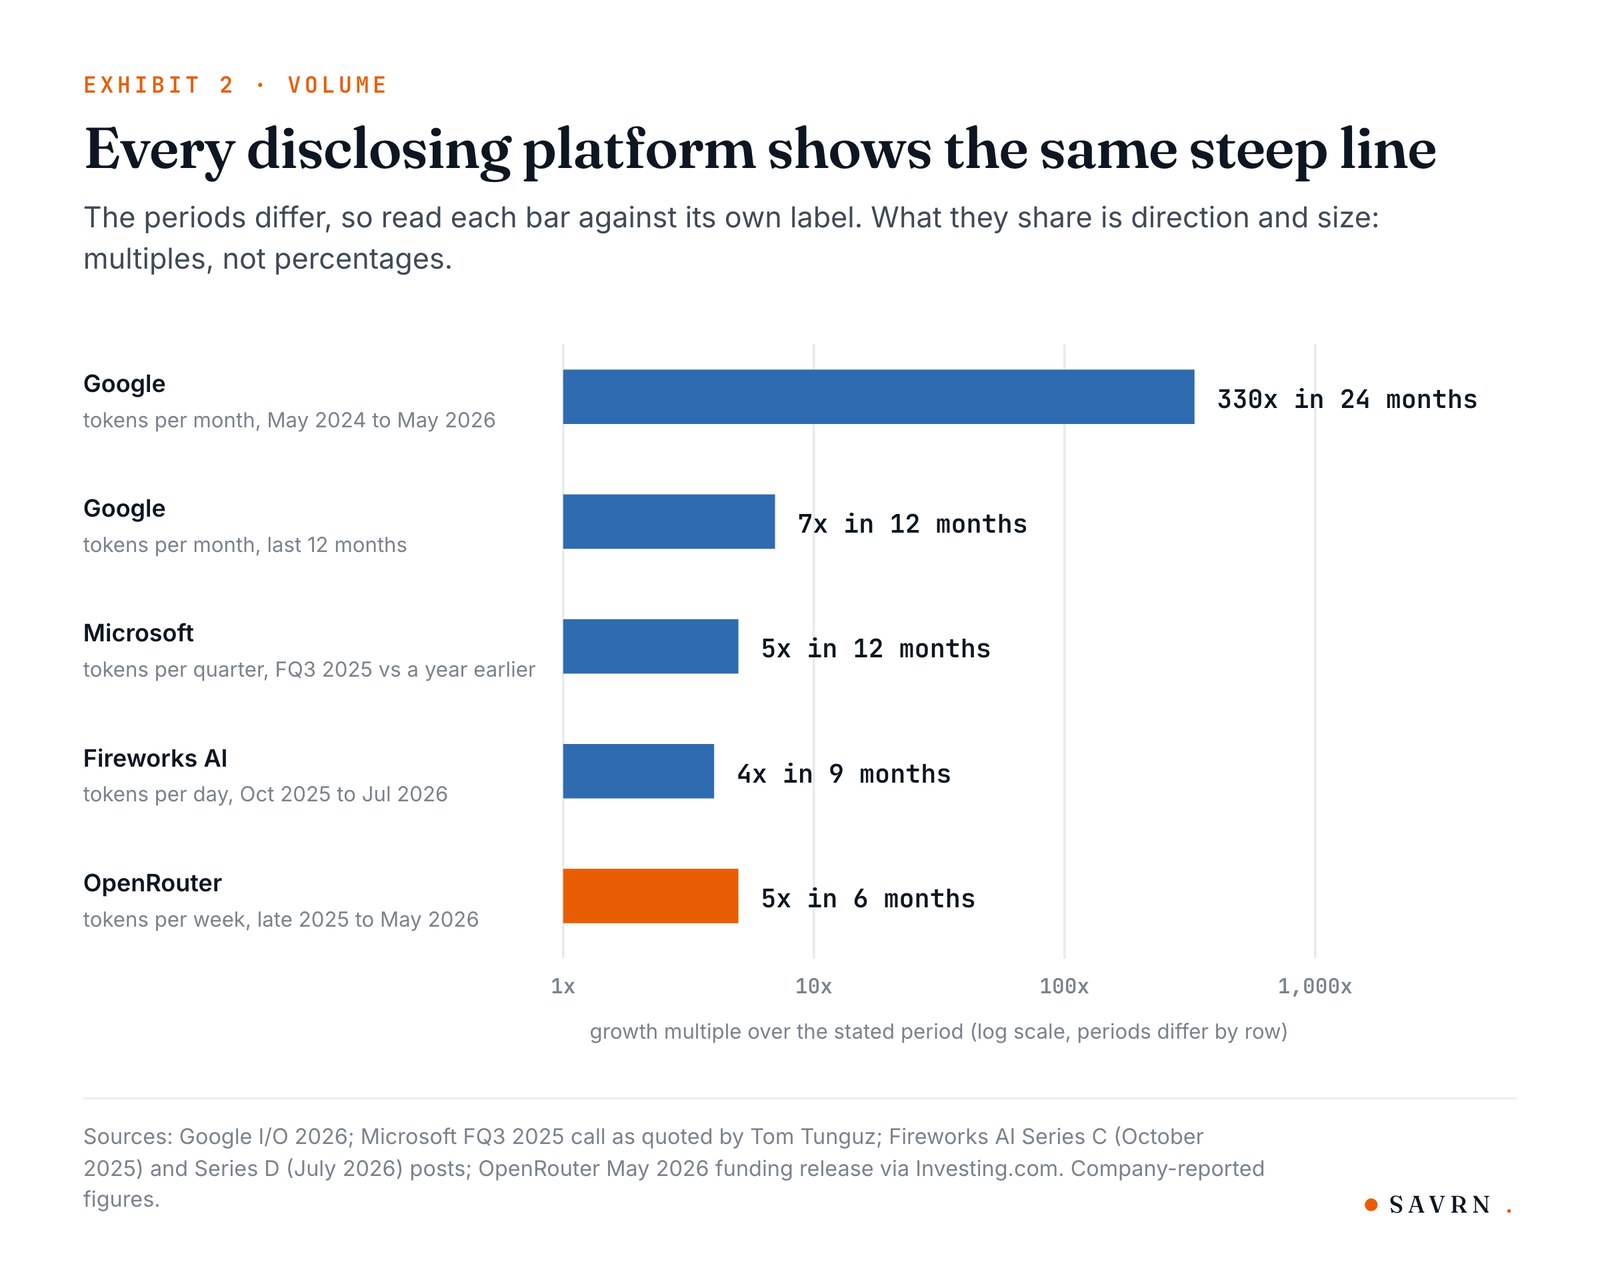
Table 1 What each platform disclosed
Two structural drivers explain why the slope steepened instead of flattening. The first is reasoning models. On OpenRouter, the share of tokens routed through reasoning models went from a negligible slice at the start of 2025 to more than half by year-end, and reasoning multiplies the tokens spent per request.[16] The second is agentic work. Signal65’s analysis for Dell finds agentic workloads consuming 4 to 15 times more tokens than chat, while an April 2026 arXiv study of coding agents measured a ceiling near 1,000 times more tokens than code chat.[17, 18] Average sequence length on OpenRouter more than tripled in twenty months, from under 2,000 tokens to over 5,400.[16] That study describes OpenRouter’s own traffic, a self-selected developer mix rather than the whole market.
Token volume is therefore not a proxy for user growth, because it is user growth times engagement depth times reasoning intensity times agent fan-out, and every one of those factors is still rising.
The forecast-miss record
If the volume numbers above had been anticipated, they would carry less weight as evidence, but they were not. The most instructive exhibit is the forecast-revision record. For example, Dell raised its 2028 inference-token forecast from 1 quadrillion to 57 quadrillion tokens, a 57 times revision in under a year, and one executive added, “I’m sure we’re wrong.” At roughly 370 trillion tokens a day, about 135 quadrillion annualized, actual consumption is already about 2.4 times Dell’s revised 2028 forecast, according to I/O Fund’s reporting.[2]
Goldman Sachs’s May 2026 report is Wall Street’s most recent benchmark, and it projects monthly global token processing rising from 1.7 quadrillion in mid-2025 to 47 quadrillion in 2028 and about 120 quadrillion by mid-2030, more than 70 times in five years, while agentic workloads supply about 101 quadrillion of the 2030 total, over 80 percent.[2] The critical observation is where actuals sit against that aggressive forecast. The mid-2026 run rate of roughly 11 quadrillion tokens a month is about double Goldman’s own May 2026 estimate of 5.6 quadrillion.[2] That run rate is I/O Fund’s estimate rather than a Goldman figure, and because Goldman’s own page would not load for my checks, I cite the forecast as I/O Fund reports it.
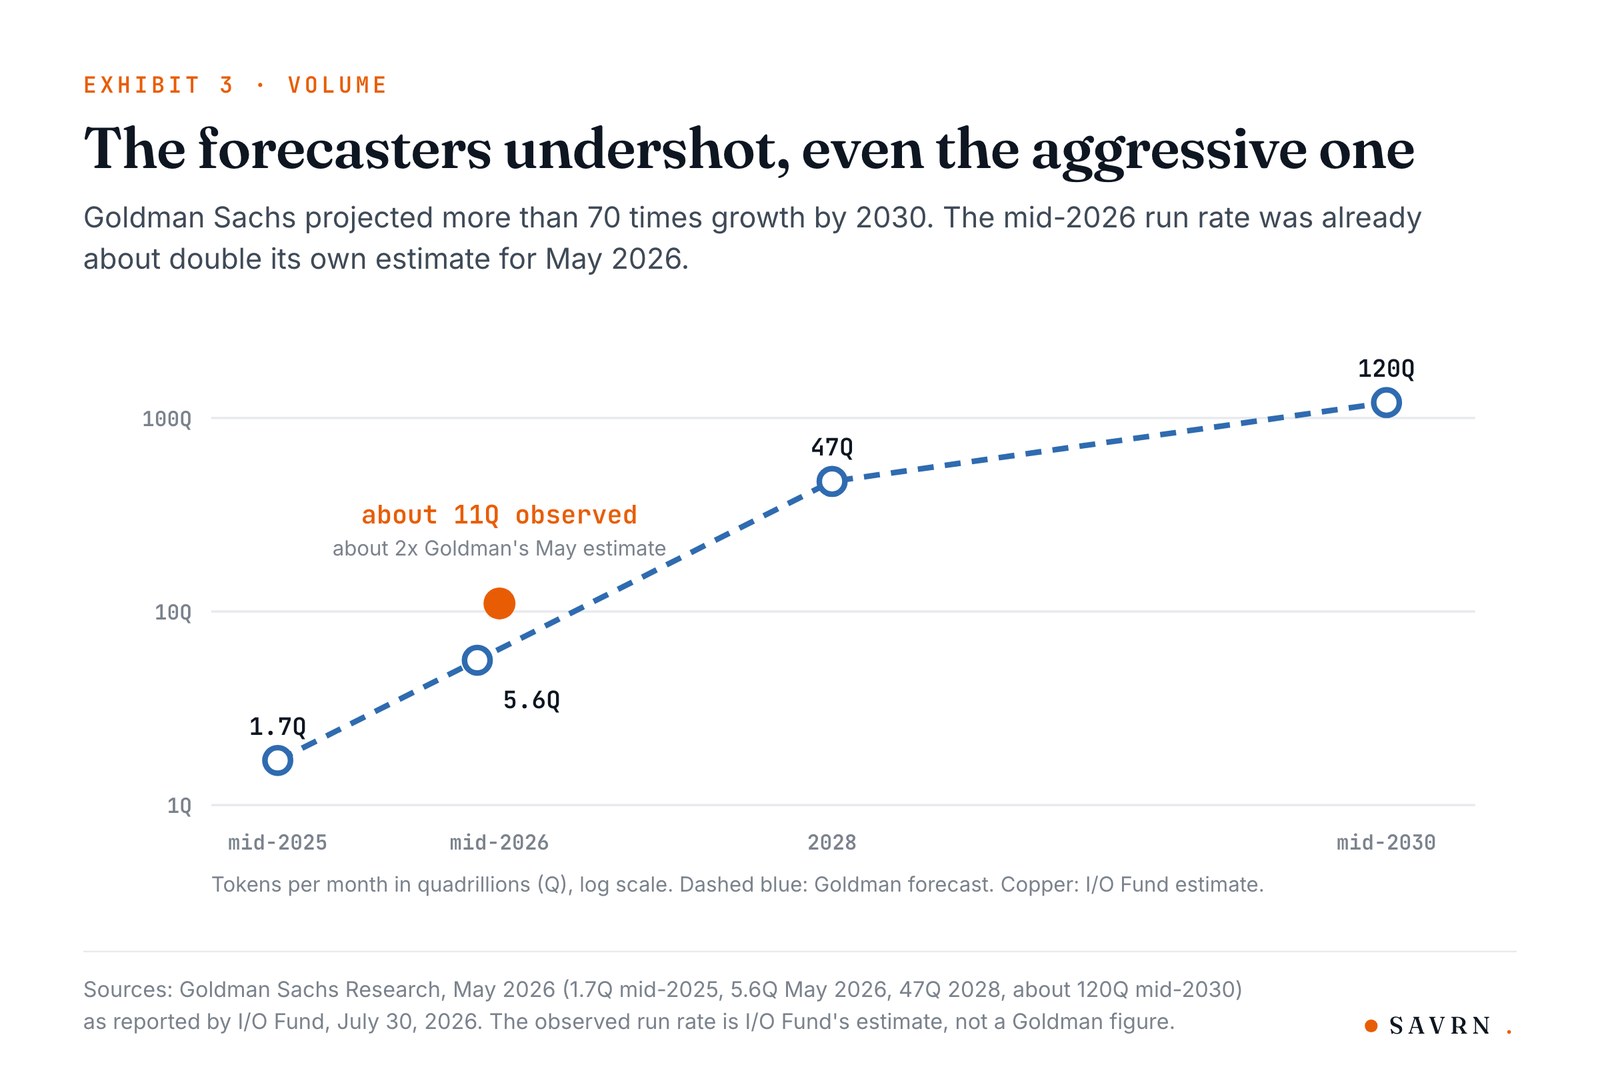

The forecasts I could find have all undershot, typically within twelve months of publication, although that does not guarantee the next one will. Reasoning-token inflation may overstate economically meaningful usage, and skeptics raise that point legitimately.[8] But it establishes the base-rate asymmetry that the demand side of any infrastructure model should start from, because the observable errors have all run in one direction, and the direction is up.
2. The Price Side: Three Measurement Bases, Three Different Answers
Fixed-capability deflation is real, and irrelevant to posted revenue
The canonical deflation statistics are not wrong, although they are conditional. a16z’s “LLMflation” analysis found that for an LLM of equivalent performance, inference cost falls about 10 times a year. GPT-3 launched in November 2021 at $60 per million tokens, and by November 2024 the cheapest model with the same MMLU score, Llama 3.2 3B, cost $0.06.[3] Epoch AI’s benchmark-anchored measurement, from six benchmarks over three years, found that the price of reaching a fixed performance milestone falls between 9 and 900 times a year depending on the benchmark and threshold. Epoch itself cautions, however, that the fastest drops came in the past year and may not persist.[4] The “Price of Progress” study from MIT FutureTech, revised in March 2026, formalized the same object, an efficiency-frontier price at fixed benchmark performance. In particular, it found declines of 5 to 10 times a year for frontier models, almost 32 times a year in the highest performance bin, and only about 1.7 times a year in the lowest.[19]
The analytical error is to apply a fixed-capability deflator to a market where nobody holds capability fixed. Instead of freezing their model at GPT-4-equivalent quality to pocket the savings, buyers upgrade to the newest, most capable model and pay its posted price. Menlo Ventures’ mid-2025 survey of about 150 technical leaders quantifies the behavior: only 11 percent of teams changed model providers in the past year, while 66 percent upgraded to newer models from their existing vendor.[20] The demand curve sits on the quality frontier rather than at a fixed point on the quality axis. The deflation that matters for revenue is therefore the deflation of posted prices on the models people actually buy, which is a different and much slower series.
Posted prices and the quality-upgrade wedge: about 9 percent a year, not 90
An August 2026 arXiv preprint, whose title is The Price of Intelligence: A Quality-Adjusted Price Index for AI Services, built the index the debate was missing. Its panel has 21,024 posted-price observations across 3,208 models and 86 providers, joined to 4,605 benchmark scores through a latent quality measure, with a pre-registered method.[5] Measured the way statistical agencies measure software, posted and matched-model prices fell only 0.098 log points a year between January 2025 and August 2026, about 9.3 percent, whereas at constant quality the same market fell 0.728 log points a year, about 52 percent. The wedge between them is 0.63 log points a year, which means 87 percent of the quality-adjusted decline never shows up in posted prices, because new, better models arrive at old prices and matched-model methods are blind to that arrival.[5]
The preprint adds a finding that sharpens the demand story. Counted per completed task instead of per token, the buyer’s price stopped falling over the measurable window, because reasoning models raised token use faster than token prices fell. The per-task and per-token series diverged by about 0.98 log points a year.[5] That is a point estimate with a wide interval, from about 0.02 to 1.95, and because the study is an unrefereed preprint, I read it as direction, not as precision. Even so, it is Jevons-paradox arithmetic measured instead of asserted: the unit price falls, consumption of units rises faster, and the bill goes up.
An independent tracker points the same way on posted-price magnitudes. BenchLM’s frontier-token index stood 84 percent below its March 2023 base on September 18, 2026, which annualizes to roughly 40 percent a year off a 2023 starting point dominated by GPT-4 launch pricing, although it printed flat month over month in that snapshot.[21] One flat print is one data point rather than proof that deflation has slowed, and BenchLM itself notes there is no guarantee of a straight decline.
Forward curves: even the deflation forecasters do not forecast revenue collapse
Forward price forecasts, translated into the blended terms that actually reach a buyer’s budget, are shallower than the headline statistics. A 2026 to 2030 token cost forecast from StratoFactory, built from tier-weighted vendor pricing, projects the blended enterprise cost of inference falling from about $4.75 to $1.57 per million tokens, roughly 24 percent a year compounded, with frontier-tier prices falling only about 12.5 percent a year because frontier capability keeps a persistent premium.[22] StratoFactory is a small vendor-side research brief, so I treat it as one forecast rather than a benchmark.
Gartner’s March 2026 forecast projects that inference on a one-trillion-parameter LLM will cost providers over 90 percent less in 2030 than in 2025, which works out to about 37 percent a year on a fixed-model basis, my arithmetic.[23] Specifically, it names semiconductor efficiency, model-design innovation, higher utilization, and inference-specialized silicon as the drivers. Gartner also says overall inference costs are expected to increase because token consumption is rising faster than token costs are falling.[23] Even the institution forecasting one of the steepest credible unit-cost declines forecasts rising total spend. In fact, that is the volume-wins arithmetic, stated from the deflation side.
3. Net Revenue Arithmetic: Volume Times Price, and Volume Wins
Enterprise spend tripled in twelve months while unit prices fell
The definitive test of whether deflation destroys revenue is realized spend rather than a model. Menlo Ventures’ annual enterprise report found enterprise generative-AI spend of $37 billion in 2025, up from $11.5 billion in 2024, a 3.2 times increase in a single year, after $1.7 billion in 2023.[6] Its mid-2025 update found enterprise LLM spend more than doubling in six months, from $3.5 billion in November 2024 to $8.4 billion by mid-2025, and the December report puts foundation-model APIs at $12.5 billion for the full year.[20, 6] Menlo’s 2026 outlook names the mechanism. Net spend keeps rising despite falling inference costs, driven by an orders-of-magnitude increase in inference volume.[6] Because Menlo does not publish a blended price series, the “falling prices” half of that sentence comes from the price sources in Section 2.
Company-level numbers tell the same story, although at steeper slopes. Fireworks AI crossed $1 billion in annualized revenue while serving more than 40 trillion tokens a day, with more than 95 percent of that traffic on models specialized on customers’ own data.[12] Microsoft’s CEO said over 300 customers are on track to process over one trillion tokens on Foundry this year, a cohort accelerating 30 percent quarter over quarter.[24] Across every window where both sides can be measured, volume has grown several-fold a year at the hyperscalers, with Google at 7 times and Microsoft at 5, while posted prices have fallen by single digits to low double digits a year.
The refinement: the real risk is fixed silicon, not fixed capability
The accurate version of the deflation thesis survives in one place, and the model has to be explicit about it. What loses pricing power is the output of a fixed, aging silicon generation rather than “tokens” in the abstract. An H200 fleet deployed in 2024 competes in 2026 against GB300 capacity that serves roughly 12.6 times more tokens per megawatt on the same DeepSeek V4 Pro agentic workload at the same interactivity target, my division of SemiAnalysis’s figures.[7] The comparison mixes precisions, FP8 on the H200 and FP4 on the newer part, and SemiAnalysis discloses that. No amount of demand growth restores the older fleet’s unit economics, because the marginal buyer prices capacity off the newest cost curve. It is the same mechanism behind Gartner’s point that commoditized intelligence trends toward near-zero cost while the compute needed for advanced reasoning stays scarce.[23] The price floor collapses first for exactly the workloads the old fleet can serve.
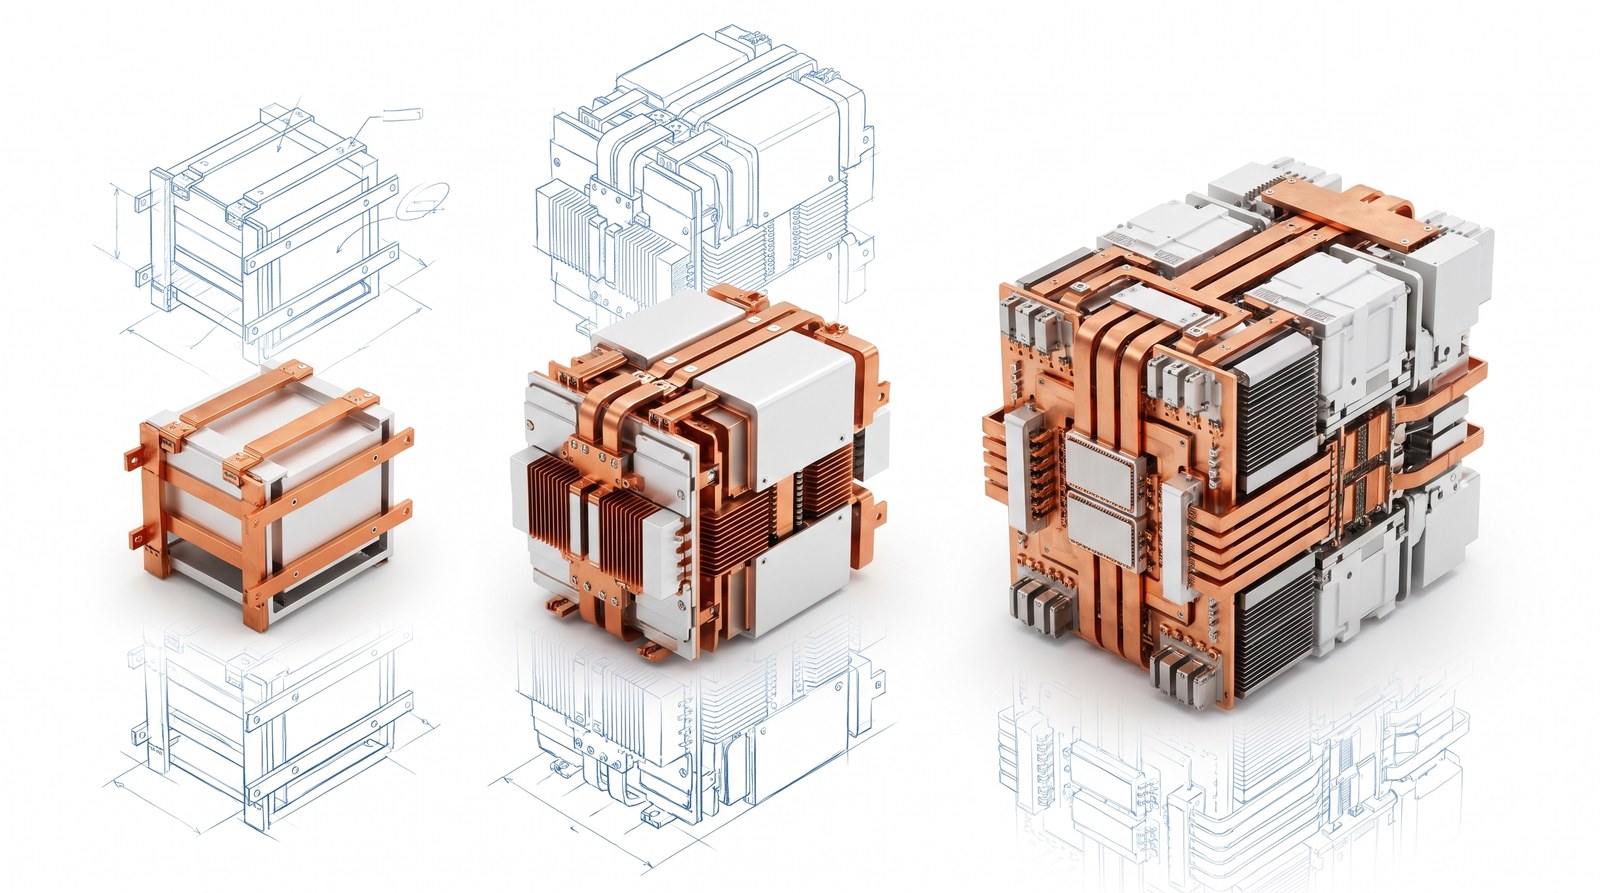
This refinement turns the deflation debate from a demand question into an asset-management question. If a fleet’s revenue life is bounded by generational pricing power instead of by demand, the binding constraint on returns is the cadence and economics of refresh, which is an engineering and balance-sheet variable, not a macro one. It also explains why the quality-upgrade wedge in Section 2 persists. As long as each new model generation needs new silicon to be served economically at scale, the posted-price index rides the frontier forward instead of collapsing with the fixed-capability frontier. Fixed-silicon pricing power is the risk rather than demand destruction, and that risk has a known, priced mitigation: a refresh reserve.
4. NVIDIA Generational Throughput: “We Will Push More Tokens” Is Now a Measured Convention
The InferenceX ladder: about 26 times more tokens per megawatt across three generations
The refresh thesis requires that each silicon generation delivers enough extra throughput per unit of scarce power to reset the cost curve. That is now measured rather than promised. SemiAnalysis’s InferenceX and AgentX benchmark is open source, replays real coding-agent traffic, and is supported by the major serving frameworks. It published the first verified Vera Rubin agentic results on September 14, 2026.[7] On the DeepSeek V4 Pro 1.6T agentic workload at a target of 100 tokens per second per user, throughput per megawatt measures 2.26 million on the H200, 6.95 million on the B200, 28.5 million on the GB300 NVL72, and 59.4 million on the VR200 NVL72. That is about 26 times more tokens on the same megawatt across three NVIDIA generations.[7] Within the comparison, Rubin holds a 2.09 times advantage over the strongest measured GB300 serving engine, although the H200 runs in FP8 and the newer parts in FP4, a caveat SemiAnalysis discloses, and the multiples in the exhibit are my arithmetic on its numbers.
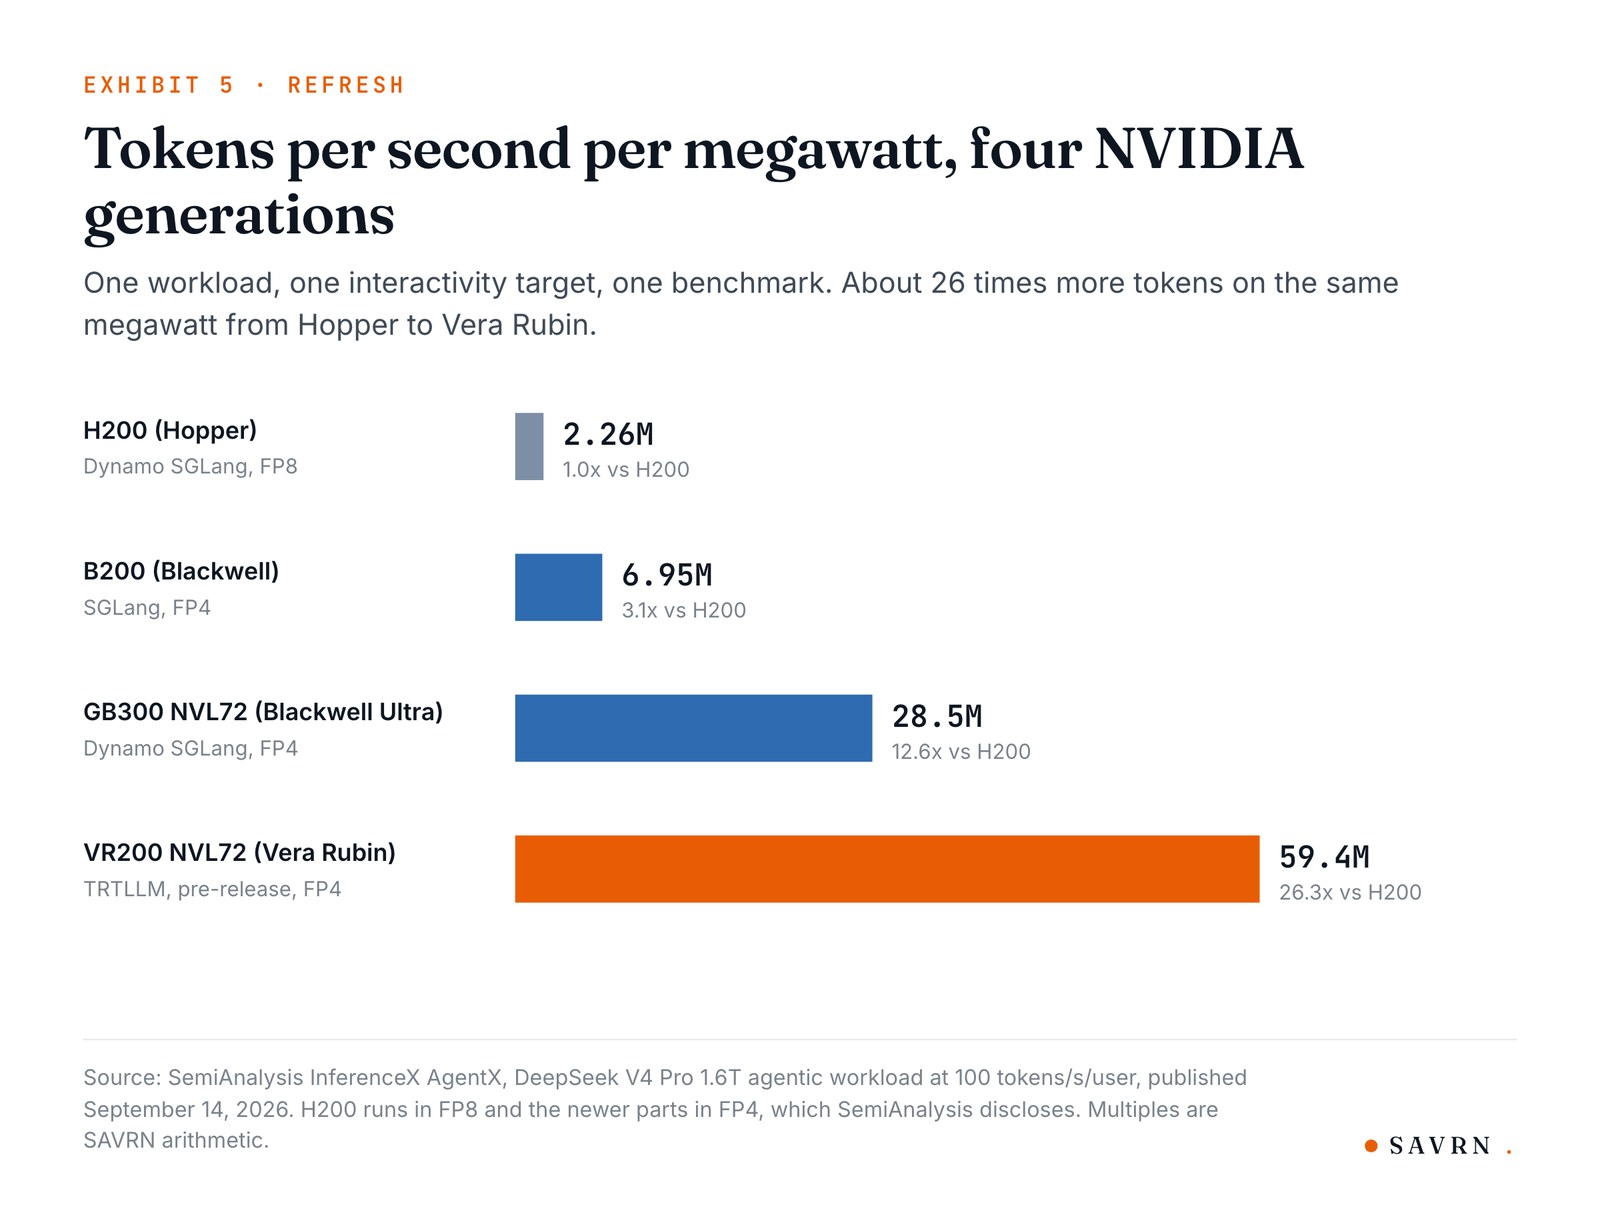
A second property of the ladder matters for refresh economics: software maturity widens hardware gaps over time. SemiAnalysis tracked DeepSeek V4 on the B200 from day 0 to day 43, about six weeks, and saw throughput per megawatt rise about 1.7 times, from roughly 300,000 to 500,000 tokens per second, purely from serving-stack optimization on fixed silicon.[25] While the Rubin measurements come from early bring-up, the authors expect the gap to widen as the software stack matures.[7] They also say NVIDIA should stop sandbagging its performance claims at GTC.[7]
NVIDIA’s published roadmap: the multiples are a convention, not a surprise
NVIDIA’s own multiples are the vendor side of the same story, and they are claims rather than measurements. At GTC 2026, NVIDIA said the VR200 NVL72 delivers 3.3 times the inference performance of the GB300 NVL72.[26] It also said token costs for agentic AI drop to roughly one-tenth and MoE training needs one-quarter the GPUs, and those two figures are against the earlier GB200 NVL72 rather than the GB300.[26] NVIDIA’s developer blog claims up to 10 times higher inference throughput per megawatt and about 10 times lower token cost versus Blackwell for Kimi K2, and up to 35 times higher throughput per megawatt when Vera Rubin is paired with the Groq 3 LPX rack for trillion-parameter, high-context workloads.[27] A later NVIDIA post says the GB300 NVL72 delivers up to 15 times the throughput per megawatt of an H200 NVL8 and up to 10 times lower cost per million tokens on DeepSeek V4 Pro.[28] Every figure there is an “up to.”
The forward cadence is disclosed with equal specificity. Rubin CPX, a prefill-specialized part with 128 GB of GDDR7 and 30 PFLOPS of NVFP4, anchors the Vera Rubin NVL144 CPX rack at 8 exaflops of NVFP4, 7.5 times the AI performance of a GB300 NVL72, with 100 TB of fast memory and 1.7 PB/s of bandwidth. NVIDIA expected first systems by the end of 2026 when it announced the part in September 2025.[29] Rubin Ultra moves to four compute dies per package with about 100 PFLOPS of FP4 per package and 1 TB of HBM4E, on the Kyber NVL576 rack that packs 576 GPUs into 144 packages. Tom’s Hardware places it in 2027 and VRLA Tech puts it in the second half,[30, 31] while Feynman follows in 2028.[31] An annual cadence with an order-of-magnitude step every two generations is a published convention with a multi-year runway, which is exactly the assumption a refresh model has to defend with citations instead of hope.
Economics per gigawatt: throughput converts to profit where power is the constraint
The ladder matters financially because data centers are increasingly power-capped, not chip-capped. Tokens per megawatt rather than tokens per chip is the binding unit of revenue capacity.[7] On SemiAnalysis’s modeled economics, Rubin NVL72 generates about 39 percent more annual revenue and about 42 percent more profit per gigawatt than the strongest GB300 configuration. That is $149.9 billion versus $105.3 billion of modeled annual profit per all-in utility gigawatt, under stated assumptions of 75 tokens per second per user, 60 percent utilization, and no model license fee. In addition, SemiAnalysis reports more than twice the profit per gigawatt of the Blackwell platform on key agentic workloads, even on early software.[7, 32, 33]
Table 2 Vera Rubin NVL72 against the strongest GB300 configuration
These economics close the loop on Section 3. The fixed-silicon risk is real and measurable, because a fleet that skips a generation competes against 2 to 12 times better per-megawatt economics within two to four years, from the Rubin-over-GB300 and GB300-over-H200 steps. The mitigation is equally real. Specifically, across the three measured steps, H200 to B200, B200 to GB300, and GB300 to VR200, the per-megawatt step ran about 3.1 times, 4.1 times, and 2.1 times, my arithmetic, and that compounds against whatever posted-price deflation the market actually delivers, roughly 9 to 24 percent a year rather than 90. Refresh is not a defensive expense in this arithmetic. It is instead the mechanism by which the volume side of the ledger keeps accruing to the asset owner.
5. Synthesis: The Refresh Multiplier Grid
Transparent scenario arithmetic
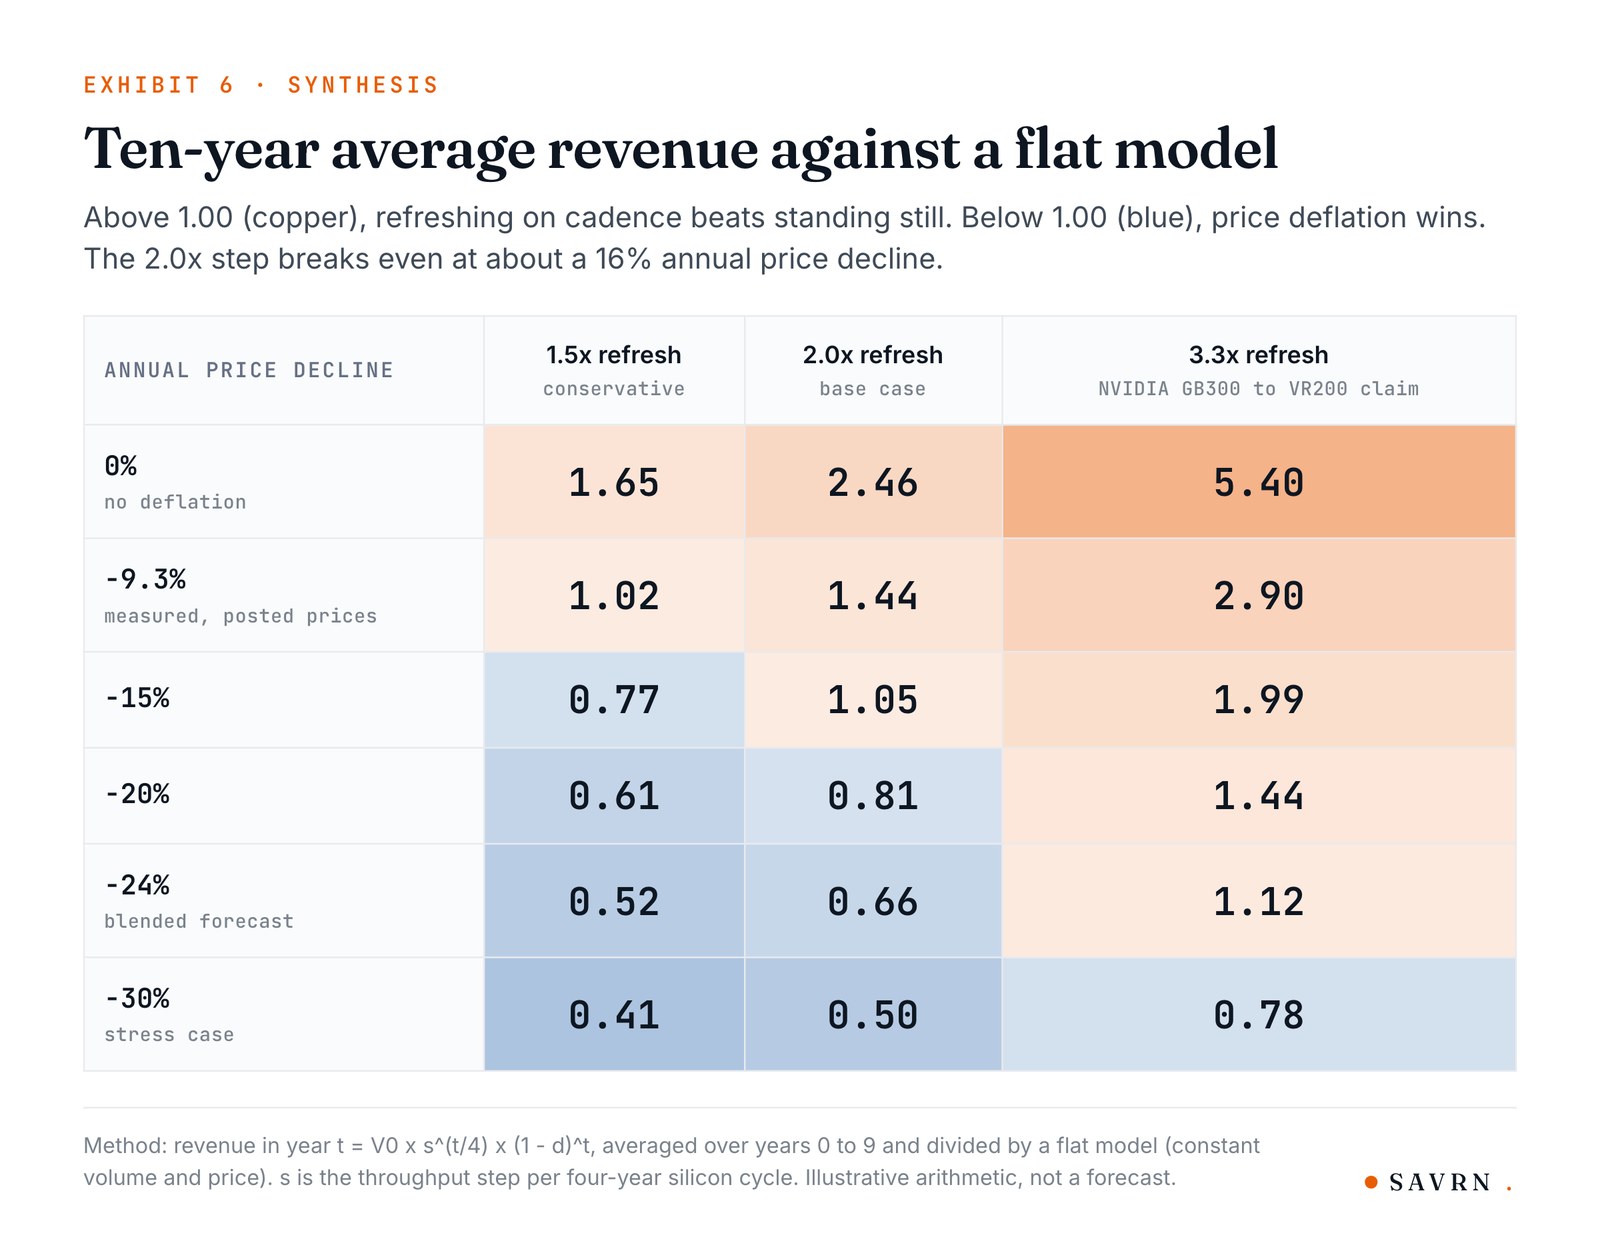
The two empirical strands therefore combine into one modeling convention. Annual fleet revenue scales as volume times posted price, while volume gets a refresh step-up s per four-year silicon cycle and price follows one of the measured or forecast paths from Section 2. The grid computes ten-year average annual revenue relative to a flat model with constant volume and constant price, using revenue in year t equal to V0 times s to the power t/4 times (1 minus d) to the power t, averaged over years 0 to 9. I use three step-ups: a conservative 1.5 times, a base 2.0 times, and a third at 3.3 times, which NVIDIA claims for GB300 to VR200.[26] SemiAnalysis’s measured 2.09 times sits between the base and the claimed case.[7] Price paths run from no deflation, through the measured 9.3 percent posted-price decline and the 24 percent blended forecast, to a stress case of 30 percent.[5, 22] This is illustrative arithmetic rather than a forecast.
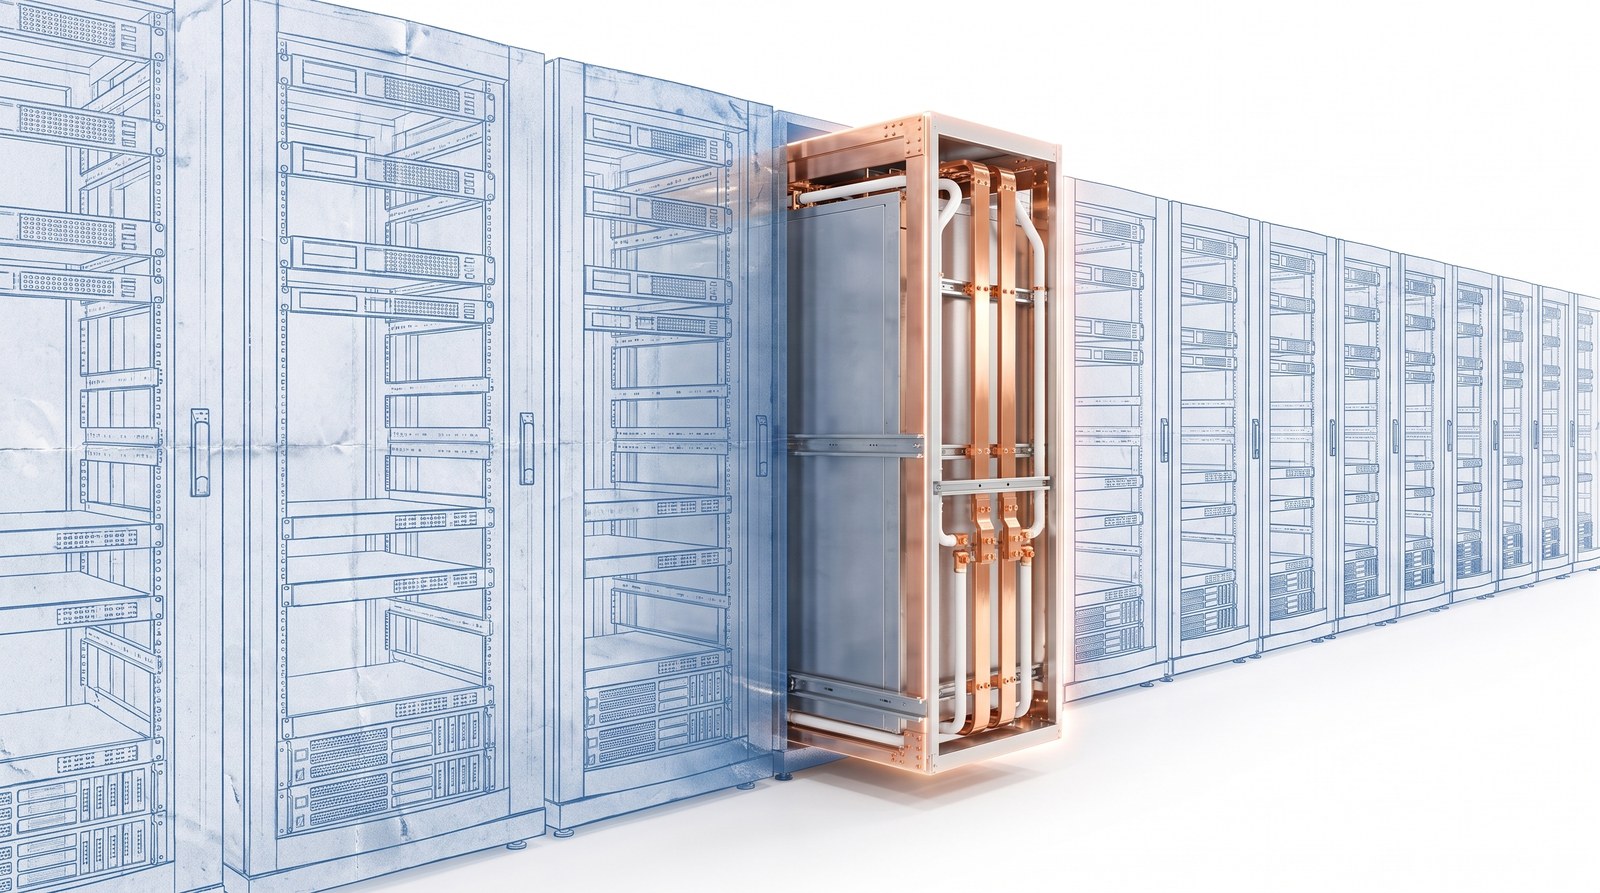
SAVRN’s own workbook variant uses discrete four-year step timing with a demand-growth overlay, and it gives the same direction, although with higher breakevens. At 2 times refresh steps, for example, ten-year cumulative revenue is 1.22 times the flat model at a 15 percent annual price decline, 0.83 times at 30 percent, and 2.01 times at flat prices. In the GB300 scenario that is $49.4 billion, $30.0 billion, and $20.4 billion of ten-year cumulative revenue across the three price paths. Both conventions, despite their different timing, agree on the load-bearing conclusion.
The grid formalizes the central claim. Specifically, at exactly the measured 9.3 percent decline, a conservative 1.5 times step roughly matches the flat model at 1.02, the base 2 times step beats it by 44 percent at 1.44, while the 3.3 times step reaches 2.90. At the 24 percent blended forecast, the 3.3 times step still clears the flat model at 1.12. The breakeven is the useful number for planning, and a 2 times refresh per cycle tolerates about a 16 percent annual price decline before ten-year revenue falls below the flat model. The 1.5 times step tolerates about 9.6 percent, which is why it only just holds at the measured rate, whereas the 3.3 times step tolerates about 25.8 percent. Together with the 12.5 percent frontier-tier forecast, that is why the measured 2 to 4 times generational steps matter, and why 1.5 times is not enough.
What would change my mind
An accurate model states its kill criteria: first, the demand side would be falsified by two consecutive quarters of declining token volume at two or more of the platforms that disclose it, Google, Microsoft, OpenRouter, and Fireworks. Current trajectories show the opposite, since OpenRouter handled 13 trillion tokens in the week ended February 9, 2026, up from 6.4 trillion in the first week of January.[34] Second, the price side would be falsified by posted list prices starting to decline at fixed-capability rates, so that the posted and matched-model indices converge on the quality-adjusted rate, although the preprint’s data through August 2026 does not show that.[5] A nearer-term warning sign would be frontier posted prices falling faster than 25 percent a year while volume growth slows below 2 times a year, the combination where even 2 times refresh steps stop clearing the flat model.
Third, the throughput side would be falsified by the generational ladder flattening, a Rubin or Feynman generation delivering materially less than about 2 times the measured tokens per megawatt of its predecessor at production software maturity. Current evidence points the other way, since pre-release Rubin software already measures 2.09 times over GB300’s best engine, and the disclosed roadmap runs through Feynman in 2028.[7, 31] Reasoning-token inflation, the possibility that token counts overstate useful work, is the strongest qualitative caveat.[8] It cuts less than it appears to, because tokens are what providers bill and what fleets must serve, and the per-task analysis suggests buyers’ realized costs held even as token prices fell.[5]
6. Conclusion
The empirical record as of September 2026 supports the base case with one refinement. Demand growth is real, observed, and running ahead of the forecasts I could find: Google’s monthly tokens grew 7 times in a year and Microsoft’s quarterly tokens 5 times, while the aggressive Goldman forecast is already about 2 times behind the run rate.[1, 9, 2] Price deflation is real but misquoted. The 10 to 900 times a year figures measure fixed capability, while posted prices, which is what revenue is made of, fell about 9.3 percent a year over the latest 19 months, because a quality-upgrade wedge absorbs 87 percent of the capability deflation into better models at unchanged prices.[3, 5] The net of the two is measured rather than theorized: enterprise AI spend tripled in a year.[6] The refinement is that the deflation risk survives for fixed silicon, because a generation’s pricing power erodes on a two-to-four-year clock. The mitigation is equally empirical: measured per-generation throughput steps of 2 to 4 times that turn refresh from a cost line into the revenue engine.[7] Volume times price, and volume ultimately wins, provided the fleet refreshes on cadence.
This is the reasoning behind how we write capacity contracts at SAVRN, with refresh options into the next GPU generation built into the terms, as described in The Unmetered Rack and in Beyond the Baseline. You can check current GPU prices yourself in the SAVRN Index.
This post summarizes third-party data and forecasts that carry their own methods and uncertainties, and it is not investment, financial, or legal advice. Vendor figures from Google, Microsoft, NVIDIA, Fireworks, and ByteDance are self-reported, and the SemiAnalysis measurements reflect specific benchmark configurations and early software.
Chad Everett Harris, Founder, SAVRN
Frequently asked questions
Is AI token demand growing faster than token prices are falling?
Yes, over every window where both can be measured, since Google’s monthly tokens grew 7 times in the last 12 months and Microsoft’s quarterly tokens 5 times year over year.[1, 9] Meanwhile posted per-token prices fell about 9.3 percent a year between January 2025 and August 2026, and enterprise generative-AI spend rose 3.2 times from 2024 to 2025.[5, 6]
How fast are AI token prices actually falling?
It depends on what is held fixed: at fixed capability, a16z finds about 10 times a year while Epoch AI finds 9 to 900 times a year.[3, 4] At constant quality, a 2026 preprint finds about 52 percent a year, whereas for posted prices, the price buyers actually pay, it finds about 9.3 percent a year.[5]
Why do posted prices fall so much less than fixed-capability prices?
Because buyers upgrade instead of holding quality fixed. In Menlo’s mid-2025 survey only 11 percent of teams changed model providers, while 66 percent upgraded to newer models from their existing vendor.[20] New, better models arrive at old prices, and as a result 87 percent of the quality-adjusted decline never appears in posted prices, according to the preprint.[5]
How much has AI token volume grown?
Google went from 9.7 trillion to over 3.2 quadrillion tokens a month in 24 months, about 330 times.[1] Fireworks AI went from more than 10 trillion tokens a day in October 2025 to more than 40 trillion by July 2026, while OpenRouter’s weekly volume rose from 5 trillion to 25 trillion tokens in six months.[11, 12, 14] All of these are company-reported figures.
Have AI token demand forecasts been too low?
The ones I could find have been, since Goldman Sachs projected more than 70 times growth in monthly global tokens by 2030 while the mid-2026 run rate was already about double its May 2026 estimate, per I/O Fund’s reporting.[2] Dell raised its 2028 forecast from 1 quadrillion to 57 quadrillion tokens, and in fact actual consumption is already about 2.4 times the revised figure.[2]
What is the real risk to AI infrastructure returns?
A fixed silicon generation losing pricing power, rather than falling demand. On the same agentic workload, GB300 NVL72 serves about 12.6 times more tokens per megawatt than an H200, and therefore an older fleet cannot restore its unit economics with demand growth alone.[7] The mitigation is instead refreshing on cadence.
How much more efficient is each NVIDIA generation?
On SemiAnalysis’s DeepSeek V4 Pro agentic benchmark at 100 tokens per second per user, throughput per megawatt runs 2.26 million on the H200, 6.95 million on the B200, 28.5 million on the GB300 NVL72, and 59.4 million on the VR200 NVL72, about 26 times end to end.[7] The H200 runs in FP8 while the others run in FP4, which SemiAnalysis discloses.
How much price deflation can a refresh cadence absorb?
In this post’s illustrative arithmetic, a 2 times step per four-year cycle breaks even against a flat model at about a 16 percent annual price decline. A 1.5 times step breaks even near 9.6 percent, whereas a 3.3 times step near 25.8 percent. The measured posted-price decline, however, is about 9.3 percent a year.[5]
What would prove this thesis wrong?
Two consecutive quarters of declining token volume at two or more of Google, Microsoft, OpenRouter, and Fireworks would break the demand side, while posted prices declining at fixed-capability rates would break the price side. Finally, a Rubin or Feynman generation delivering well under about 2 times its predecessor’s tokens per megawatt would break the refresh side.
How does this connect to SAVRN's capacity contracts?
SAVRN writes capacity contracts as a workload-scoped envelope with refresh options into the next GPU generation, and as a result the buyer is not stuck on a fixed silicon generation.[35] You can read the full framing in The Unmetered Rack, and check today’s GPU prices in the SAVRN Index.
Sources
- Google, Sundar Pichai keynote, Google I/O 2026.
- I/O Fund, “AI Token Demand Is Shattering Forecasts,” July 30, 2026, reporting Goldman Sachs, Dell, and platform figures.
- Andreessen Horowitz, “Welcome to LLMflation: LLM inference cost is going down fast,” November 12, 2024.
- Epoch AI, “LLM inference prices have fallen rapidly but unequally across tasks,” March 12, 2025.
- “The Price of Intelligence: A Quality-Adjusted Price Index for AI Services,” arXiv:2608.29843, August 30, 2026 (unrefereed preprint).
- Menlo Ventures, “2025: The State of Generative AI in the Enterprise,” December 9, 2025.
- SemiAnalysis, “Vera Rubin NVL72 agentic inference: first verified AgentX results,” September 14, 2026.
- The Decoder, “Google boasts 1.3 quadrillion tokens each month, but the figure is mostly window dressing,” 2025.
- Tom Tunguz, “Microsoft FQ3 2025 earnings,” quoting Satya Nadella on the April 30, 2025 call.
- a16z and OpenRouter, “State of AI,” December 4, 2025.
- Fireworks AI, Series C announcement, October 28, 2025.
- Fireworks AI, Series D announcement, July 15, 2026.
- CNBC, Fireworks AI valuation report, July 16, 2026.
- Investing.com, “OpenRouter raises $113M as token volume surges to 25T weekly,” May 26, 2026.
- CEIBS, column on China’s AI token consumption, April 16, 2026.
- OpenRouter and a16z, State of AI study, arXiv:2601.10088, January 2026.
- Signal65, “The Economics of Agentic AI,” May 1, 2026.
- Bai et al., “How Do AI Agents Spend Your Money? Analyzing and Predicting Token Consumption in Agentic Coding Tasks,” arXiv:2604.22750, April 24, 2026.
- Gundlach, Lynch, Mertens, Thompson, “The Price of Progress: Price Performance and the Future of AI,” MIT FutureTech, arXiv:2511.23455v2, March 2026.
- Menlo Ventures, “2025 Mid-Year LLM Market Update,” July 2025.
- BenchLM, “LLM Pricing Trends,” snapshot of September 18, 2026.
- StratoFactory, “AI Token Cost Forecast 2026 to 2030,” May 2026.
- Gartner, press release on 2030 inference costs for a 1-trillion-parameter LLM, March 25, 2026.; HPCwire, “Gartner Forecasts 90% Drop in LLM Inference Costs by 2030,” March 25, 2026.
- Microsoft Investor Relations, FY26 Q3 earnings call, April 29, 2026.
- SemiAnalysis InferenceX, “DeepSeek V4 Pro 1.6T: Day 0 to Day 43 performance,” June 9, 2026.
- Tech-Insider, “NVIDIA GTC 2026 Rubin GPU analysis.”; GPUSmith, “NVIDIA Vera CPU price and specs,” citing DatacenterDynamics.; NVIDIA, Vera Rubin NVL72 product page.
- NVIDIA Developer Blog, “Scaling token factory revenue and AI efficiency by maximizing performance per watt,” March 2026.
- NVIDIA Developer Blog, “NVIDIA Vera Rubin and Blackwell set a new standard for agentic AI performance per watt,” August 24, 2026.
- Wccftech, “NVIDIA Rubin CPX GPU: 128 GB GDDR7, 30 PFLOPS,” reporting NVIDIA’s September 2025 announcement.
- Tom’s Hardware, “Nvidia’s Vera Rubin platform in depth.”
- VRLA Tech, “NVIDIA GPU roadmap 2026 to 2030.”
- TradingView and Stocktwits, “Vera Rubin AI accelerator delivers 2x profit per GW than Blackwell, SemiAnalysis says,” September 2026.
- AI Weekly, “SemiAnalysis benchmarks Vera Rubin NVL72 at 7x Blackwell’s tokens per MW,” September 15, 2026.
- Business Insider, “OpenClaw AI demand and token use surge,” February 2026.
- SAVRN, “The Unmetered Rack,” September 2, 2026.
Want the next one?
When a new piece publishes on SAVRN Insights, you get one email with what it covers and a link to read it. No digests, no promotions.
Also send me
One email when it publishes. Unsubscribe in one click. Privacy
Volume Beats Price
Get this page’s updates by email
One email when this page updates. Nothing else.
We use your address only to send these updates. See our Privacy Policy.