Tokens per Watt: The Metric That Prices an AI Factory
Tokens per watt, throughput divided by power, converts scarce grid power into saleable AI output, and it swings 10x to 100x for the same chip depending on where power is measured.
Tokens per watt is the number of output tokens an AI system generates per second for each watt of electrical power it consumes, calculated as tokens per second divided by watts. Specifically, its inverse, joules per token (often written as watts per token), is the energy required to produce a single token. The metric thus converts an AI factory’s scarcest input, grid power, into its only saleable output, and it is the denominator behind every tokens-per-dollar number an operator quotes.
The figure, however, is not a constant for a chip. The same accelerator can post a 10x to 100x range depending on whether power is measured at the GPU or the utility meter, and on the model, precision, batch size, context length, and per-user latency target. Accordingly, this guide gives the formula, published benchmark figures by accelerator generation with their exact test context, a 1 MW worked example from the meter to tokens per dollar, and the measurement standards that make the numbers comparable.
What is tokens per watt and how is it calculated?
The base formula is throughput divided by power:
[
\text{tokens per watt} = \frac{\text{tokens per second}}{\text{watts}} = \frac{\text{tokens}}{\text{joule}}
]
Because one watt is one joule per second, tokens per second per watt reduces to tokens per joule. Conversely, the inverse is energy per token:
[
\text{joules per token} = \frac{\text{watts} \times \text{seconds}}{\text{tokens produced}} = \frac{1}{\text{tokens per watt}}
]
The EuroMLSys 2025 paper “Advocating Energy-per-Token” defines the metric exactly this way, as power multiplied by wall-clock time divided by tokens processed, and argues it should sit alongside latency and throughput as a first-class serving metric ([1]). The ML.ENERGY leaderboard likewise uses the same identity, stating that “Throughput per Watt = Work / Energy” ([2]).
Similarly, at data center scale, the industry reports the same quantity in larger units. SemiAnalysis’s InferenceMAX benchmark, for example, reports “tokens/s per all-in provisioned MW of total utility power,” and NVIDIA reports “throughput per megawatt” ([3]; [4]). Divide tokens per second per MW by 1,000,000 to get tokens per second per watt; divide 1,000,000 by tokens per second per MW to get joules per token.
Notably, two conventions matter when reading any published figure. First, “Tokens” almost always means output (decode) tokens, with input tokens folded into a fixed sequence length such as 1K in, 8K out. Second, “Watts” can mean nameplate thermal design power (TDP), measured GPU power, server power at the wall, or utility power for the whole facility. SemiAnalysis notes that “TDP is not the same as expected average power,” which is why its metric uses provisioned utility power rather than chip TDP ([3]).
Chip-level, server-level, rack-level, and facility-level tokens per watt
In fact, every step from the GPU die to the utility meter adds power that produces no tokens. As a result, a tokens-per-watt figure is meaningless without stating which boundary it uses.
First, chip level divides throughput by GPU power only. The Hugging Face AI Energy Score, for instance, measures GPU energy via nvidia-smi and scores “solely on GPU energy,” excluding CPU and RAM ([5]). Chip-level numbers are therefore the highest an operator will ever see.
Second, server level adds host CPUs, memory, NICs, fans, and power supply losses. MLCommons’ MLPerf Power rules, similarly, require AC power to be measured “at the wall” for the system under test, including host CPU, accelerators, memory, and fans, during the same run that produces the performance score ([6]). An NVIDIA DGX H100 illustrates the gap: eight H100 SXM GPUs at up to 700 W each total 5.6 kW, whereas the system’s maximum power is 10.2 kW, so GPUs are about 55 percent of server power at nameplate ([7]; [8]).
Third, rack level adds in-rack networking and, for rack-scale systems, the NVLink switch trays and host CPUs. GB300 NVL72, for example, combines 72 Blackwell Ultra GPUs with 36 Grace CPUs in one liquid-cooled rack, all drawing power against the same token output ([9]).
Finally, facility level divides by utility power, which adds cooling, power distribution losses, and everything else captured by Power Usage Effectiveness (PUE), the ratio of total facility energy to IT energy standardized as ISO/IEC 30134-2:2016 ([10]). The Uptime Institute’s 2025 survey put the industry average PUE at 1.54, flat for roughly six years, while Google reported a 2025 fleet-wide PUE of 1.09 ([11]; [12]). NVIDIA cites roughly 1.25 PUE for Blackwell deployments with about 20 percent air cooling, 1.1 for fully liquid-cooled Vera Rubin at 45°C inlet water, and furthermore warns that at gigawatt scale “up to 40% of the power can be lost before it reaches compute” ([13]).
Hence the practical rule: a chip-level figure of 1 token per joule becomes roughly 0.55 tokens per joule at the server wall in a DGX H100 and roughly 0.36 tokens per joule at the meter of a PUE 1.54 facility. Because only the facility-level figure ties to an electricity bill, only the facility-level figure belongs in a tokens-per-dollar calculation. Why PUE alone understates AI-hall losses is covered in Beyond PUE.
Published tokens per watt and energy per token by accelerator generation
The table lists only figures traceable to a primary or reputable technical source, with the exact test context, and flags vendor figures. Independent figures come from SemiAnalysis InferenceMAX/InferenceX (open-source, run nightly on NVIDIA and AMD hardware), the ML.ENERGY leaderboard, and peer-reviewed work. Where a source reports tokens per second per MW, joules per token is 1,000,000 divided by that figure.
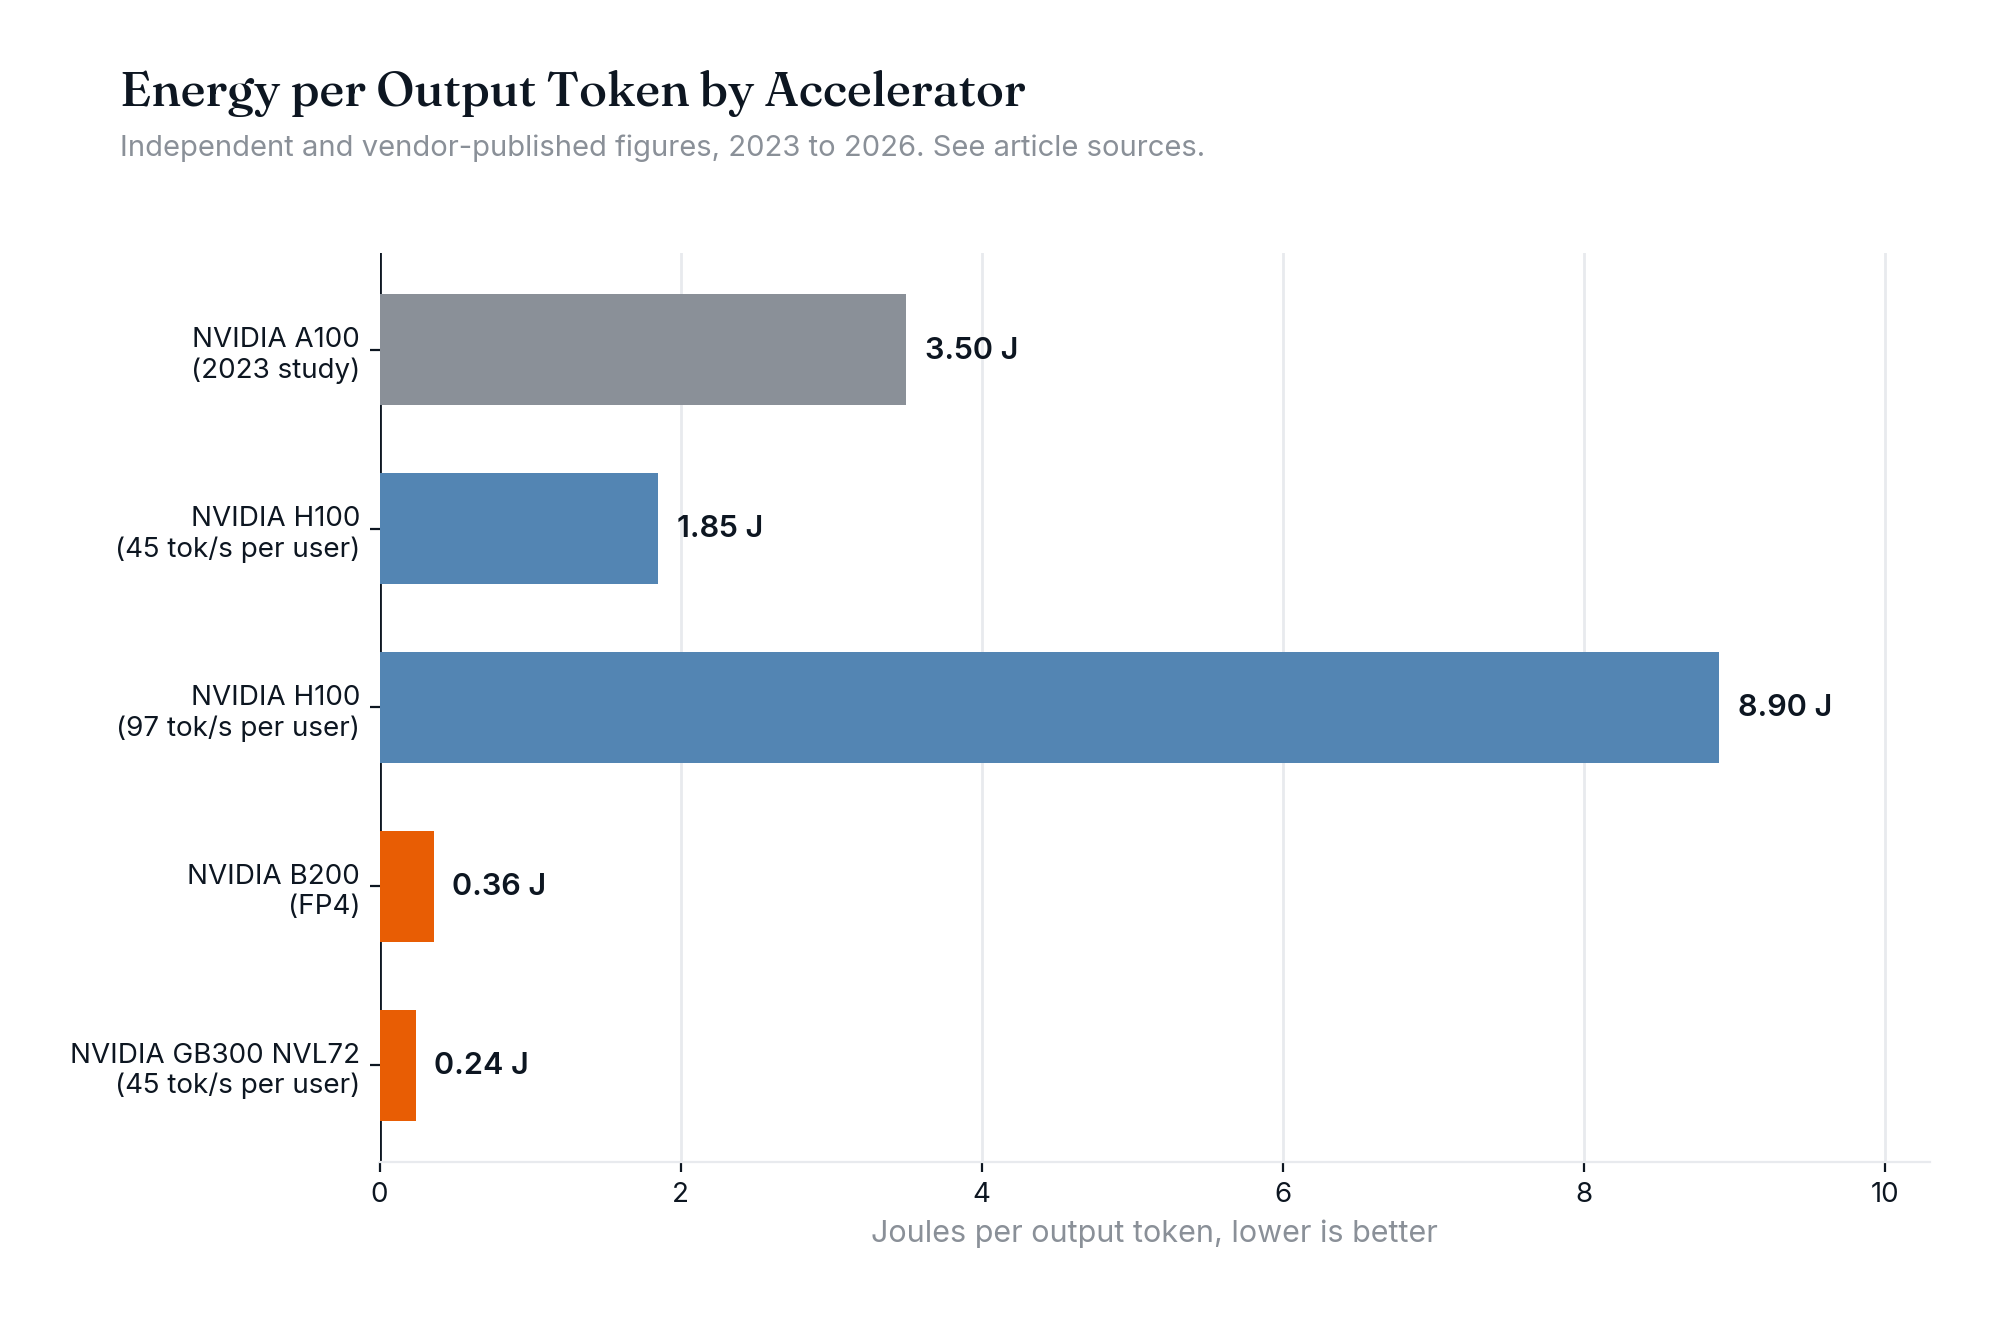
Table 1 Measured and published energy per token by accelerator
NVIDIA A100 SXM (400 W)
Peer-reviewed~3 to 4 J per output token (0.25 to 0.33 tokens/J), GPU-cluster power
Benchmark contextLLaMA 65B, batch 64 to 512, 8 to 32 GPU shards, output length 512 to 1,024
Source typePeer-reviewed (IEEE HPEC 2023)
Source [14] · [15]
NVIDIA H100 SXM (700 W)
Independent539,778 tok/s per all-in provisioned MW = 0.54 tok/s/W = 1.85 J/token; falls to 112,644 tok/s/MW = 8.9 J/token at higher interactivity
Benchmark contextDeepSeek-R1-0528, 739.5 tok/s/GPU at 45 tok/s/user; 154.3 tok/s/GPU at 97 tok/s/user; interpolated Pareto across FP8 configs and 1K/1K, 1K/8K, 8K/1K sequences; utility power incl. facility overhead
Source typeIndependent (SemiAnalysis, interpolated dashboard)
Source [16] · [7]
NVIDIA H100 (700 W)
Independent900,000 tok/s per all-in provisioned MW = 1.11 J/token
Benchmark contextGPT-OSS 120B, FP4, InferenceMAX v1
Source typeIndependent (SemiAnalysis)
Source [3]
NVIDIA H200 SXM (700 W)
Vendor54,000 tok/s per MW = 18.5 J/token; 90 tok/s/GPU
Benchmark contextDeepSeek R1, ISL 32K / OSL 8K, FP8 in-flight batching; "projected performance subject to change"
Source typeVendor marketing (NVIDIA baseline row)
Source [17] · [18]
NVIDIA B200 (1 kW)
Independent2,800,000 tok/s per all-in provisioned MW = 0.36 J/token, about 3x H100 at the same interactivity
Benchmark contextGPT-OSS 120B, FP4, InferenceMAX v1
Source typeIndependent (SemiAnalysis)
Source [3]
NVIDIA B200 (1 kW), GPU-only energy
Independent0.151 to 0.312 J/token (3.2 to 6.6 tokens/J) depending on batch size and task
Benchmark contextQwen3 32B dense, 1x B200, vLLM 0.11.1, GPU energy only; B200 median 35% less energy than H100 across 46 models
Source typeIndependent (ML.ENERGY Leaderboard v3.0)
Source [2]
NVIDIA GB200 NVL72
Independent~8x tokens/s per MW vs H200 FP8 single node
Benchmark contextDeepSeek R1, 30 tok/s/user, FP4, no multi-token prediction
Source typeIndependent (SemiAnalysis)
Source [3]
NVIDIA GB300 NVL72
Independent4,105,187 tok/s per all-in MW = 0.24 J/token at 45 tok/s/user; 2,607,497 tok/s/MW = 0.38 J/token at 97 tok/s/user
Benchmark contextDeepSeek-R1-0528, 8,703 and 5,528 tok/s/GPU, FP4 and FP8 configs, interpolated
Source typeIndependent (SemiAnalysis, interpolated dashboard)
Source [16]
NVIDIA GB300 NVL72
Vendor2,800,000 tok/s per MW (50x the H200 row above); 35x lower cost per token
Benchmark contextDeepSeek R1, ISL 32K / OSL 8K, FP4, Dynamo disaggregated serving; "projected"
Source typeVendor marketing
Source [17]
NVIDIA Vera Rubin NVL72 (2H 2026)
Vendor marketing, pre-release"up to 10x higher inference throughput per watt" vs Blackwell; "up to 30x higher throughput per megawatt than GB300 NVL72" on the AgentX workload
Benchmark contextMixture-of-experts models; pre-release, forward-looking
Source typeVendor marketing, pre-release
Source [19] · [20]
Google TPU Ironwood
Vendor2x performance per watt vs Trillium; "nearly 30x" vs first Cloud TPU (2018)
Benchmark contextMeasured as peak FP8 FLOPS per watt of chip TDP, not tokens; 9,216-chip pod ~10 MW
Source typeVendor marketing (FLOPS/W, not tokens/W)
Source [21]
AMD MI300X (750 W)
Independent750,000 tok/s per all-in provisioned MW = 1.33 J/token
Benchmark contextGPT-OSS 120B, MX4, reasoning 1K in / 8K out, 90 tok/s/user, InferenceMAX v1
Source typeIndependent (SemiAnalysis)
Source [3] · [22]
AMD MI355X (1.4 kW)
Independent2,550,000 tok/s per all-in provisioned MW = 0.39 J/token, ~3x MI300X
Benchmark contextSame GPT-OSS 120B MX4 context as MI300X row
Source typeIndependent (SemiAnalysis)
Source [3] · [23]
AMD MI355X vs GB300 NVL72
Independent3,632,663 vs 5,825,707 tok/s/MW (0.28 vs 0.17 J/token) at 95 tok/s/user; 913,385 vs 2,237,582 at 167 tok/s/user
Benchmark contextDeepSeek-R1-0528, interpolated
Source typeIndependent (SemiAnalysis, interpolated dashboard)
Source [24]
Three cautions, however, apply. First, InferenceX comparison pages are labeled “Interpolated from real benchmark data” and update as software improves; the GB300 NVL72 figure near 95 to 97 tok/s/user differs between the two pages fetched the same day (2.6M vs 5.8M tok/s/MW) because each interpolates from a different configuration set. Second, NVIDIA’s own pages give both “5x improvement in throughput (TPS per MW)” and “50x” for GB300 NVL72 versus Hopper, depending on workload and latency target ([9]; [17]). Third, AMD has stated that the NVIDIA 50x tokens-per-watt claim used FP4 with multi-token prediction on Blackwell against FP8 on Hopper at a 1K/1K sequence, and that “each choice favors NVIDIA’s result” ([25]). The independent numbers in the table, which show GB300 NVL72 at roughly 7.6x H100 at 45 tok/s/user and 23x at 97 tok/s/user on DeepSeek R1, are therefore the defensible range.
Why does tokens per watt vary 10x to 100x for the same hardware?
In fact, tokens per watt is a property of a configuration, not a chip. Specifically, five variables dominate.
Latency target (interactivity). Serving fewer concurrent users at higher tokens per second per user leaves more of the GPU idle per token. In the InferenceX H100 data above, moving from 45 to 97 tok/s/user cut tokens per MW from 539,778 to 112,644, a 4.8x drop, while GB300 NVL72 fell 1.6x over the same range ([16]). Cost likewise follows the same curve: B200 serving DeepSeek R1 in FP4 cost about $0.56 per million output tokens at 50 tok/s/user but about $4 at 125 tok/s/user, “2.5x speed for ~7x price” ([26]).
Batch size. Specifically, larger batches amortize weight reads across more tokens. ML.ENERGY reports that increasing batch size cuts energy per token 3x to 5x, and TokenPowerBench similarly found the steepest drop between batch 32 and 256, with a two-to-three-fold spread across batch sizes up to 1,024 ([2]; [27]). Batch size and latency target are two views of one trade: higher batch, higher tokens per watt, but fewer tokens per second per user.
Model size and architecture. TokenPowerBench measured that going from Llama 3 1B to 70B raised energy per token 7.3x while parameter count grew 70x ([27]). Mixture-of-experts models, however, narrow the gap: ML.ENERGY measured Qwen3 30B-A3B (3B active parameters) at 3.56x lower energy per token than dense Qwen3 32B ([2]). Reasoning, meanwhile, swamps all of it: Hugging Face’s AI Energy Score v2 found reasoning models use about 30x more energy per query on average, and the same weights can span 150x to 700x, with DeepSeek-R1-Distill-Llama-70B at 49.53 Wh per 1,000 queries without reasoning and 7,626.53 Wh with it ([28]).
Quantization. TokenPowerBench likewise found FP8 cut Llama 3 405B energy per token about 30 percent versus FP16 ([27]). The effect is conditional, however: ML.ENERGY measured FP8 using a median 30 percent more energy than BF16 at batch 8 to 16 but 11 percent less at batch 65 to 256, because quantization overhead only pays off when the GPU is compute-bound ([2]). In fact, FP4 on Blackwell versus FP8 on Hopper accounts for a large share of the vendor multiples cited above.
Context length. Attention cost grows with the KV cache. TokenPowerBench measured that raising Llama 3 70B context from 2K to 10K tokens roughly tripled energy per token ([27]). NVIDIA’s headline comparisons use 32K input and 8K output sequences because long-context, agentic workloads are where rack-scale NVLink domains show the largest gains ([17]).
Notably, software moves the number without any hardware change. NVIDIA reported B200 cost on GPT-OSS-120B falling from $0.11 to $0.02 per million tokens in two months of releases, and speculative decoding tripled GPT-OSS throughput from 6,000 to 30,000 tokens per second per GPU at 100 tok/s/user ([17]; [29]). Any tokens-per-watt figure therefore needs a date as well as a context. The Inference Paradox covers why these gains raise total power demand rather than lowering it.
Worked example: 1 MW at the utility meter to tokens per dollar
The chain below uses only published inputs; specifically, it assumes an H100 SXM fleet in DGX H100 servers serving DeepSeek-R1-0528 at 45 tok/s/user, 100 percent busy for a 720-hour month, and shows two facility efficiencies. Real utilization is lower, however, and every output scales linearly with it.
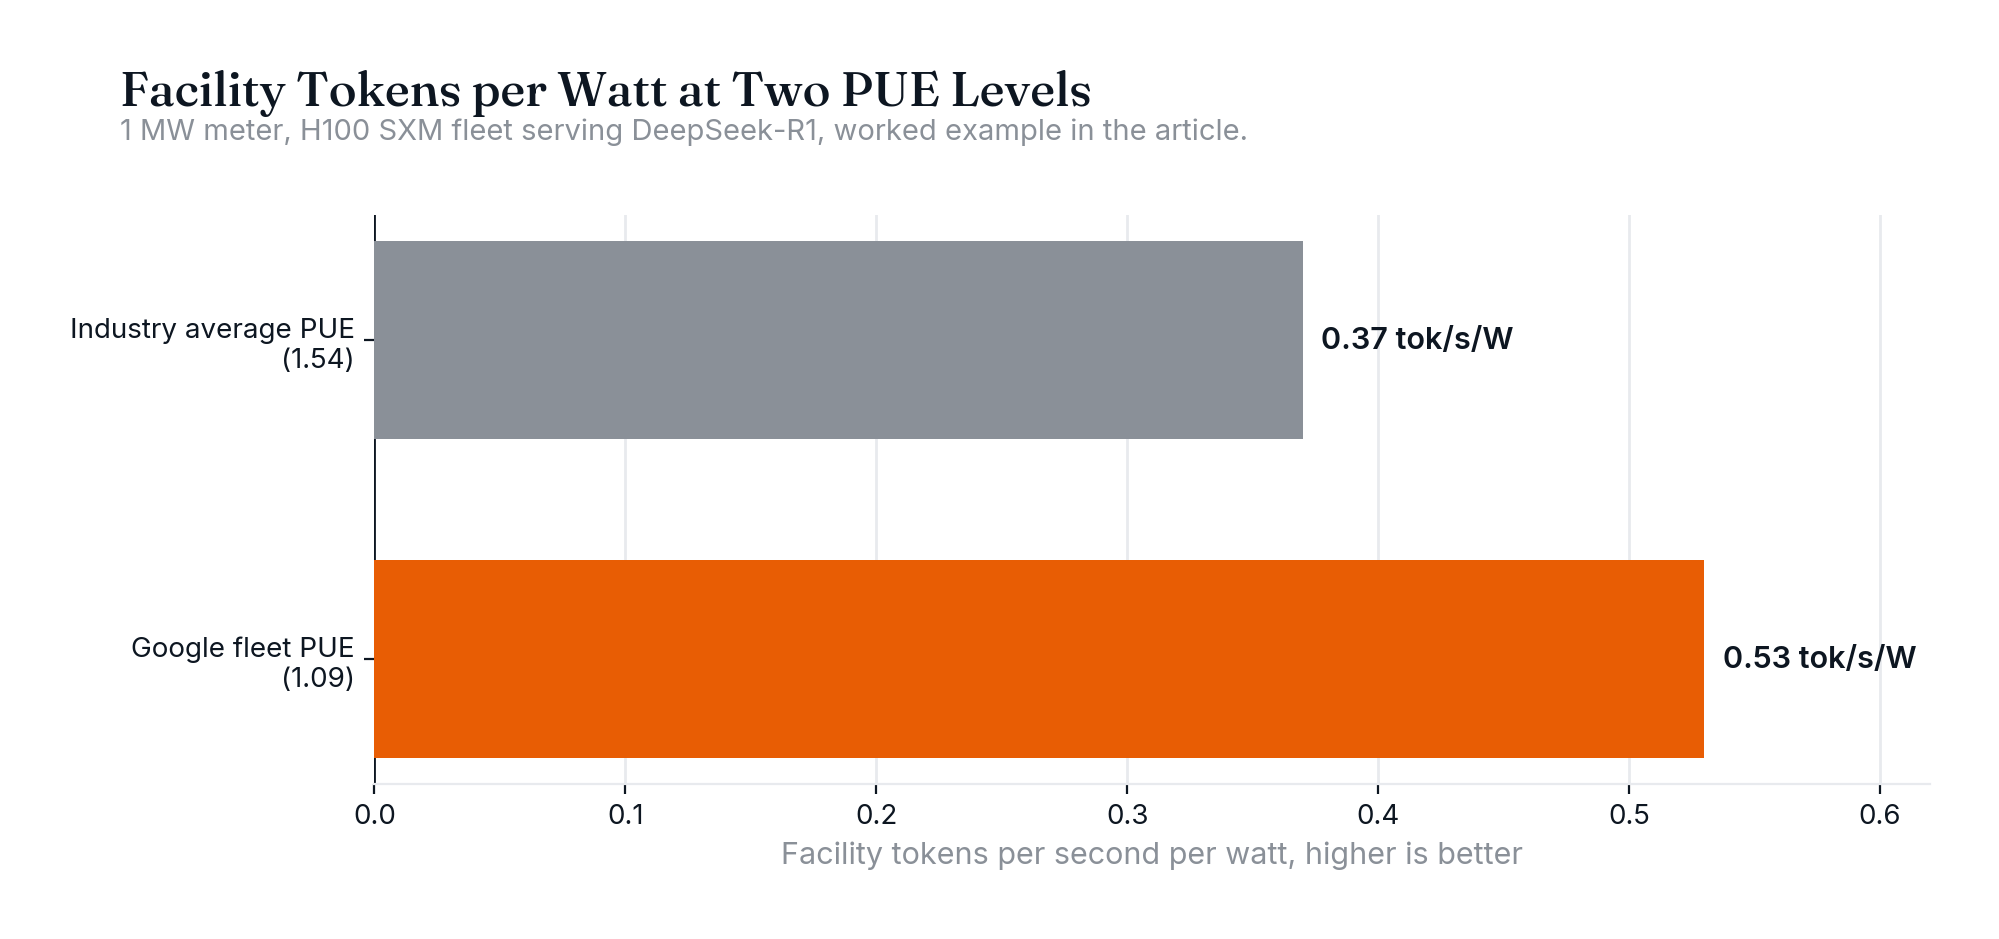
Table 2 One megawatt at the meter, walked to tokens per watt and per dollar
Accordingly, three results follow. First, at 100 percent utilization electricity is about 4 percent of rental-plus-electricity cost, consistent with SemiAnalysis’s finding that “colocation rent and electricity cost typically make up less than 20% of TCO” and that a 20 percent tokens-per-MW deficit moves TCO by under 4 percent ([3]). Second, cutting PUE from 1.54 to 1.09 raises tokens per month 41 percent on the same meter, which is the case for liquid cooling in power-constrained sites. Third, the PUE 1.09 column lands at 526,524 tok/s per MW, within 3 percent of InferenceX’s independent 539,778 tok/s per all-in provisioned MW for the same operating point, which consequently validates the chain.
The example uses nameplate server power. Measured average draw during inference is lower, so a site sized on TDP can usually host more GPUs than step 4 implies; that headroom, however, is not modeled here. Colocation rent in step 13 is a wholesale market rate for 250 to 500 kW blocks and excludes GPU capital, so it is not comparable to step 12 ([32]). The EIA price, finally, is the U.S. average industrial rate; the 2025 annual average was 8.62 ¢/kWh and the trailing 12 months through June 2026 averaged 8.87 ¢/kWh, although a specific site’s tariff can sit well outside that range ([30]).
Tokens per dollar and the “tokens per watt per dollar” composite
Tokens per dollar is tokens per watt multiplied by watts per dollar. The second term is where the capital stack enters: GPU depreciation, rack and network cost, facility construction, and financing all show up as dollars per provisioned watt per month, while electricity shows up as dollars per watt-hour. NVIDIA’s comparison table makes the decomposition explicit by listing $/GPU-hour, tokens per second per GPU, tokens per second per MW, and $/million tokens side by side: GB300 NVL72 at $2.65 per GPU-hour against HGX H200 at $1.41 is still 35x cheaper per token because throughput per GPU is 65x higher ([17]).
Operators, accordingly, use tokens per dollar to price capacity and tokens per watt to size it. When a site is power-limited, tokens per watt sets revenue per megawatt regardless of hardware price; when a site has spare power but limited capital, tokens per dollar of hardware dominates instead. AMD’s MI355X positioning shows the second lens: AMD, for example, claims up to 40 percent more tokens per dollar than B200 on Llama 3.1 405B in FP4 using CoreWeave B200 pricing, and Signal65 measured 1.42x to 2.15x B200 tokens per dollar across GPT-OSS-120B, Kimi-K2.6, and Qwen3-Next-80B at market GPU-hour rates, while the same chip trails GB300 NVL72 on tokens per MW in the InferenceX data above ([33]; [34]; [24]). In other words, a chip can win one metric while losing the other.
“Tokens per watt per dollar” is the composite some operators use to rank hardware on both axes at once, dividing tokens per watt by the all-in cost of the watt. It is useful as a screen, although it has three limits. First, it hides the latency target, so a high score can describe a batch configuration no interactive customer would accept. Second, it depends on a $/GPU-hour or $/kW-month input that varies by contract and market: Lambda lists H100 SXM at $3.99 to $6.16 per GPU-hour depending on on-demand versus cluster terms, while InferenceX’s $0.439 per million tokens for the same H100 operating point implies an all-in cost near $1.17 per GPU-hour ([31]; [16]). Third, it moves with software: the B200 5x cost improvement in two months came with no change in watts or dollars per GPU ([17]). Consequently, the composite should be reported with its model, precision, interactivity, sequence length, price basis, and date.
Watts per token: the inverse conversion
“Watts per token” and “watt per token” mean energy per token; the strictly correct unit is joules per token (watt-seconds per token), because a watt is a rate and a token is a count. The conversion is therefore:
[
\text{joules per token} = \frac{1}{\text{tokens per second per watt}} \qquad
\text{Wh per 1,000 tokens} = \frac{\text{joules per token} \times 1{,}000}{3{,}600}
]
Worked conversions from the figures above: H100 at 539,778 tok/s per MW is 0.54 tokens per joule, 1.85 J per token, or 0.51 Wh per 1,000 tokens; GB300 NVL72 at 4,105,187 tok/s per MW is 0.24 J per token or 0.068 Wh per 1,000 tokens; the H200 vendor baseline of 54,000 tok/s per MW is 18.5 J per token or 5.1 Wh per 1,000 tokens ([16]; [17]). Google’s disclosed median of 0.24 Wh per Gemini Apps text prompt equals 864 joules per prompt, which is the whole-prompt figure rather than per token ([35]).
Uptime Institute frames the metric the same way, as “joules per token (or its derivatives such as tokens per watt)” ([36]). When a vendor quotes “watts per token,” therefore, ask for the sequence length, the interactivity target, and whether the watts are chip TDP or utility power.
How is tokens per watt measured? Standards and disclosures
No single standard governs tokens per watt yet. Instead, seven efforts define how it is measured today, each with a different power boundary.

Table 3 Standards and disclosures that fix the measurement boundary
MLPerf Inference Power (MLCommons)
BoundarySystem AC power at the wall, same run as performance
What it fixesWorkload, dataset, accuracy target, latency constraints; no batteries; host and accelerators included
Status, 2026Rules published; MLPerf Power paper covers 1,841 measurements across 60 systems; only two power submissions in v5.1 (Lenovo datacenter, GATEOverflow edge); v6.0 announcement lists 24 submitters with no power results
Source [6] · [37] · [38] · [39]
PUE (The Green Grid; ISO/IEC 30134-2:2016)
BoundaryTotal facility energy ÷ IT energy
What it fixesFacility overhead only; says nothing about tokens
Status, 2026Industry average 1.54 (Uptime 2025); Google fleet 1.09
Source [10] · [11]
SemiAnalysis InferenceMAX / InferenceX
BoundaryAll-in provisioned utility MW incl. GPUs, CPUs, networking, facility overhead
What it fixesTokens/s per MW and $/M tokens across interactivity sweeps; open-source, nightly
Status, 2026Live since October 2025; v2 February 2026
Source [3]
Google per-prompt energy disclosure
BoundaryFull stack: active accelerators, host CPU/DRAM, idle capacity, PUE overhead
What it fixesMedian text prompt 0.24 Wh = 0.14 Wh accelerator + 0.06 CPU/DRAM + 0.02 idle + 0.02 overhead; accelerator-only method gives 0.10 Wh
Status, 2026Published August 21, 2025 with arXiv methodology
Source [35] · [40]
Mistral AI lifecycle assessment
BoundaryFull LCA per ISO 14040/44 with Carbone 4 and ADEME
What it fixes400-token Le Chat response: 1.14 gCO2e, 45 mL water; training Mistral Large 2: 20.4 ktCO2e
Status, 2026Published July 22, 2025
Source [41]
Hugging Face AI Energy Score
BoundaryGPU energy only, H100, batch size 1, FP16 for text generation
What it fixesWh per 1,000 queries; 1 to 5 star rating within model class
Status, 2026v2 December 4, 2025
Source [5] · [28]
ML.ENERGY Leaderboard
BoundaryGPU energy, H100 and B200, vLLM, batch sweeps
What it fixesJoules per token by model, batch, precision, task; 46 models, 1,858 configurations
Status, 2026v3.0 December 2025
Source [2]
The boundary problem is quantified in Google’s paper: the same Gemini prompt measures 0.10 Wh under an active-chip-only method and 0.24 Wh under the full-stack method, while published Llama 3.1 70B estimates range from about 580 to 3,600 prompts per kWh, a 6x spread driven by methodology rather than hardware ([40]). Microsoft Research reached a similar conclusion, estimating a median 0.34 Wh per query for models over 200B parameters on an H100 node including utilization and PUE, and finding that non-production benchmark estimates overstate energy by 4x to 20x because they omit batching ([42]).
The stakes are national. Lawrence Berkeley National Laboratory estimated U.S. data centers used 176 TWh in 2023, 4.4 percent of national electricity, and projected 325 to 580 TWh by 2028 ([43]); EPRI, similarly, projects 9 to 17 percent of U.S. electricity by 2030 ([44]).
How SAVRN builds for this
SAVRN designs AI factories against facility-level tokens per watt, not chip TDP, because the utility meter is the only boundary that appears on an invoice. Three design choices therefore follow from the numbers above.
The first is cooling. The worked example shows a 41 percent difference in tokens per month between PUE 1.54 and PUE 1.09 on the same 1 MW meter. SAVRN’s water-free AI data center designs use direct-to-chip liquid cooling to run rack-scale systems such as GB300 NVL72 at the low-PUE end of that range, so the megawatt buys tokens rather than fans and chillers.
The second is power sourcing. Because electricity is a small share of token cost at market GPU rates but the binding constraint on how many GPUs a site can host, SAVRN’s self-powered site model prioritizes firm megawatts and short interconnect timelines over the cheapest tariff.
The third is measurement. SAVRN instruments halls at the meter, the PDU, and the rack so that tokens per watt can be reported at each boundary alongside the model, precision, interactivity, and sequence length that produced it. Capacity contracts are written against a benchmarked throughput envelope rather than a GPU count, which is the only way a buyer can hold a supplier to a tokens-per-dollar figure once software and utilization start moving the number.
Chad Harris, Founder, SAVRN
Frequently asked questions
What is tokens per watt?
Tokens per watt is the number of output tokens an AI system generates per second for each watt of power it draws, calculated as tokens per second divided by watts. Since a watt is a joule per second, it equals tokens per joule. The figure, however, depends on the power boundary (chip, server, rack, or facility) and on the model, precision, batch size, context length, and latency target used in the test.
What is a token per watt versus tokens per watt per dollar?
“Token per watt” is the same metric as tokens per watt, an energy efficiency ratio. “Tokens per watt per dollar,” by contrast, divides that efficiency by the all-in cost of each watt, combining energy efficiency with capital and rental cost. The composite is useful for ranking hardware, but it must state the interactivity target, the price basis, and the date, because all three change the result.
How do I convert tokens per watt to watts per token?
Take the reciprocal. For example, if a system delivers 0.54 tokens per second per watt, energy per token is 1 ÷ 0.54 = 1.85 joules per token, or 0.51 Wh per 1,000 tokens. Strictly, “watts per token” should be expressed as joules per token, because a watt is a rate. For data center figures quoted in tokens per second per megawatt, divide 1,000,000 by that number to get joules per token.
How many watts per token does an H100 use?
It depends on the workload. SemiAnalysis’s InferenceX data for DeepSeek-R1-0528 on H100 show 539,778 tokens per second per all-in provisioned megawatt at 45 tokens per second per user, equal to 1.85 joules per token, and 112,644 tokens per second per megawatt at 97 tokens per second per user, equal to 8.9 joules per token. On GPT-OSS 120B in FP4, InferenceMAX reported 900,000 tokens per second per megawatt, about 1.1 joules per token.
What are tokens per dollar and how are they calculated?
Tokens per dollar equals tokens produced over a period divided by the all-in cost of producing them, or equivalently tokens per watt multiplied by watts per dollar. In the 1 MW worked example, 504 H100 GPUs at $3.99 per GPU-hour plus $66,024 of electricity at 9.17 cents per kWh produce 966 billion tokens per month, or about 638,000 tokens per dollar ($1.57 per million tokens) at 100 percent utilization.
What is cost per token per watt?
Cost per token per watt is another phrasing of the tokens-per-watt-per-dollar composite, although it is usually inverted to dollars per million tokens at a stated power budget. NVIDIA’s table pairs $2.65 per GPU-hour and 2.8 million tokens per second per megawatt for GB300 NVL72 against $1.41 and 54,000 for HGX H200, yielding $0.12 versus $4.20 per million tokens on DeepSeek R1 at 32K input and 8K output; these figures, however, are vendor projections.
What is AI factory efficiency in tokens per watt?
AI factory efficiency in tokens per watt is facility-level throughput divided by utility power; consequently, it includes PUE overhead as well as CPUs, networking, and idle capacity. The 1 MW worked example gives 0.37 tokens per second per facility watt at PUE 1.54 and 0.53 at PUE 1.09 for the same H100 fleet and operating point. Chip-level figures for the same GPUs, by contrast, are about 1.06 tokens per second per watt at nameplate.
What is the difference between chip-level and facility-level tokens per watt?
Chip-level tokens per watt divides throughput by GPU power alone, the highest figure an operator will ever see, while facility-level tokens per watt divides by utility power at the meter, which adds server overhead, rack networking, cooling, and every PUE-related loss. In the DGX H100 example above, a chip-level figure of 1 token per joule falls to roughly 0.55 tokens per joule at the server wall and roughly 0.36 tokens per joule at the meter of a PUE 1.54 facility. Because only the facility-level number ties to an electricity bill, it is the only boundary that belongs in a tokens-per-dollar calculation.
Why does NVIDIA publish both 5x and 50x tokens-per-watt improvement claims for GB300 NVL72?
NVIDIA’s own pages give both figures for GB300 NVL72 versus Hopper because the multiple depends on workload and latency target, not a single fixed comparison. AMD has said the 50x claim specifically used FP4 with multi-token prediction on Blackwell against FP8 on Hopper at a 1K/1K sequence, noting that “each choice favors NVIDIA’s result.” The independent SemiAnalysis data in the benchmark table above instead shows GB300 NVL72 at roughly 7.6x H100 at 45 tokens per second per user and 23x at 97 tokens per second per user, which is the more defensible range.
What is PUE and how does it affect tokens per watt?
PUE, or Power Usage Effectiveness, is the ratio of total facility energy to IT energy, standardized as ISO/IEC 30134-2:2016, and it captures cooling and power-distribution losses that sit between the utility meter and the GPUs. Because facility-level tokens per watt divides by utility power, a lower PUE directly raises the number: the worked example shows 41 percent more tokens per month on the same 1 MW meter when PUE improves from the 1.54 industry average to Google’s fleet-wide 1.09. NVIDIA has likewise warned that at gigawatt scale, up to 40 percent of power can be lost before it reaches compute, which is why liquid cooling and PUE reduction are treated as throughput levers rather than only sustainability metrics.
Is tokens per watt the same as FLOPS per watt?
No. Tokens per watt measures realized inference throughput, output tokens per second, against power draw, while FLOPS per watt measures raw computational capability regardless of whether that capacity is used to produce tokens. Google’s TPU Ironwood claims, for example, cite “2x performance per watt vs Trillium,” measured as peak FP8 FLOPS per watt of chip TDP, not tokens, so the figure cannot be compared directly to the tokens-per-second-per-watt numbers elsewhere in this guide. Consequently, a chip can post strong FLOPS per watt and still deliver mediocre tokens per watt if software, batching, or memory bandwidth prevents that capacity from converting into served tokens.
Sources
- EuroMLSys 2025, “Advocating Energy-per-Token”
- ML.ENERGY, “Diagnosing inference energy consumption with the ML.ENERGY Leaderboard v3.0,” January 29, 2026
- SemiAnalysis, “InferenceMAX: Open Source Inference Benchmarking,” October 9, 2025
- NVIDIA, “Blackwell Ultra Delivers Higher Performance and Lower Cost for Agentic AI,” February 16, 2026
- Hugging Face, AI Energy Score methodology
- MLCommons, MLPerf Inference power measurement rules
- NVIDIA, H100 Tensor Core GPU specifications
- NVIDIA, DGX SuperPOD Data Center Design (DGX H100), planning
- NVIDIA, GB300 NVL72 product page
- ISO, ISO/IEC 30134-2:2016 Power usage effectiveness (PUE)
- Google, Data center efficiency (PUE)
- Uptime Institute, 15th Annual Global Data Center Survey press release, July 30, 2025
- NVIDIA, “Scaling Token Factory Revenue and AI Efficiency by Maximizing Performance per Watt,” March 25, 2026
- Samsi et al., “From Words to Watts: Benchmarking the Energy Costs of Large Language Model Inference,” arXiv:2310.03003 (IEEE HPEC 2023)
- NVIDIA, A100 Tensor Core GPU datasheet
- SemiAnalysis InferenceX, DeepSeek R1: GB300 NVL72 vs H100
- NVIDIA, AI Inference solutions page
- NVIDIA, H200 Tensor Core GPU specifications
- NVIDIA, Vera Rubin platform press release, March 16, 2026
- NVIDIA, Deep Learning Performance (training and inference)
- Google, “Ironwood: The first Google TPU for the age of inference,” April 9, 2025
- AMD, Instinct MI300X specifications
- AMD, Instinct MI355X specifications
- SemiAnalysis InferenceX, DeepSeek R1: GB300 NVL72 vs MI355X
- AMD, “The Many Aspects of Inference Performance,” March 18, 2026
- SemiAnalysis, “InferenceX v2: NVIDIA Blackwell vs. AMD MI355X,” February 16, 2026
- Niu et al., “TokenPowerBench: Benchmarking the Power Consumption of LLM Inference,” arXiv:2512.03024, December 2, 2025
- Hugging Face, “AI Energy Score v2,” December 4, 2025
- NVIDIA, “NVIDIA Blackwell Sets New Bar in InferenceMAX Benchmarks,” October 9, 2025
- U.S. EIA, Electric Power Monthly Table 5.3, average price of electricity by sector, released August 26, 2026
- Lambda, GPU cloud pricing
- CBRE, “North America Data Center Trends H2 2025,” February 25, 2026
- AMD, “AMD Unveils Vision for an Open AI Ecosystem,” June 12, 2025
- Signal65, “AMD Instinct MI355X vs NVIDIA B200 Inference Evaluation,” July 21, 2026
- Google Cloud, “Measuring the environmental impact of AI inference,” August 21, 2025
- Uptime Intelligence, “The problem with energy per token,” May 19, 2026
- MLCommons et al., “MLPerf Power: Benchmarking the Energy Efficiency of Machine Learning Systems,” arXiv:2410.12032
- MLCommons, MLPerf Inference v5.1 results, September 9, 2025
- MLCommons, MLPerf Inference v6.0 results, April 2026
- Google, “Measuring the environmental impact of delivering AI at Google scale,” arXiv:2508.15734
- Mistral AI, “Our contribution to a global environmental standard for AI,” July 22, 2025
- Microsoft Research, “Energy Use of AI Inference: Efficiency Pathways and Test-Time Compute,” September 2025
- Lawrence Berkeley National Laboratory, “Berkeley Lab Report Evaluates Increase in Electricity Demand from Data Centers,” January 15, 2025
- EPRI, “Powering Intelligence 2026,” executive summary, February 25, 2026
Want the next one?
When a new piece publishes on SAVRN Insights, you get one email with what it covers and a link to read it. No digests, no promotions.
Also send me
One email when it publishes. Unsubscribe in one click. Privacy