On-Site Fuel Cells vs. the Grid: 20 Years of Reliability Data
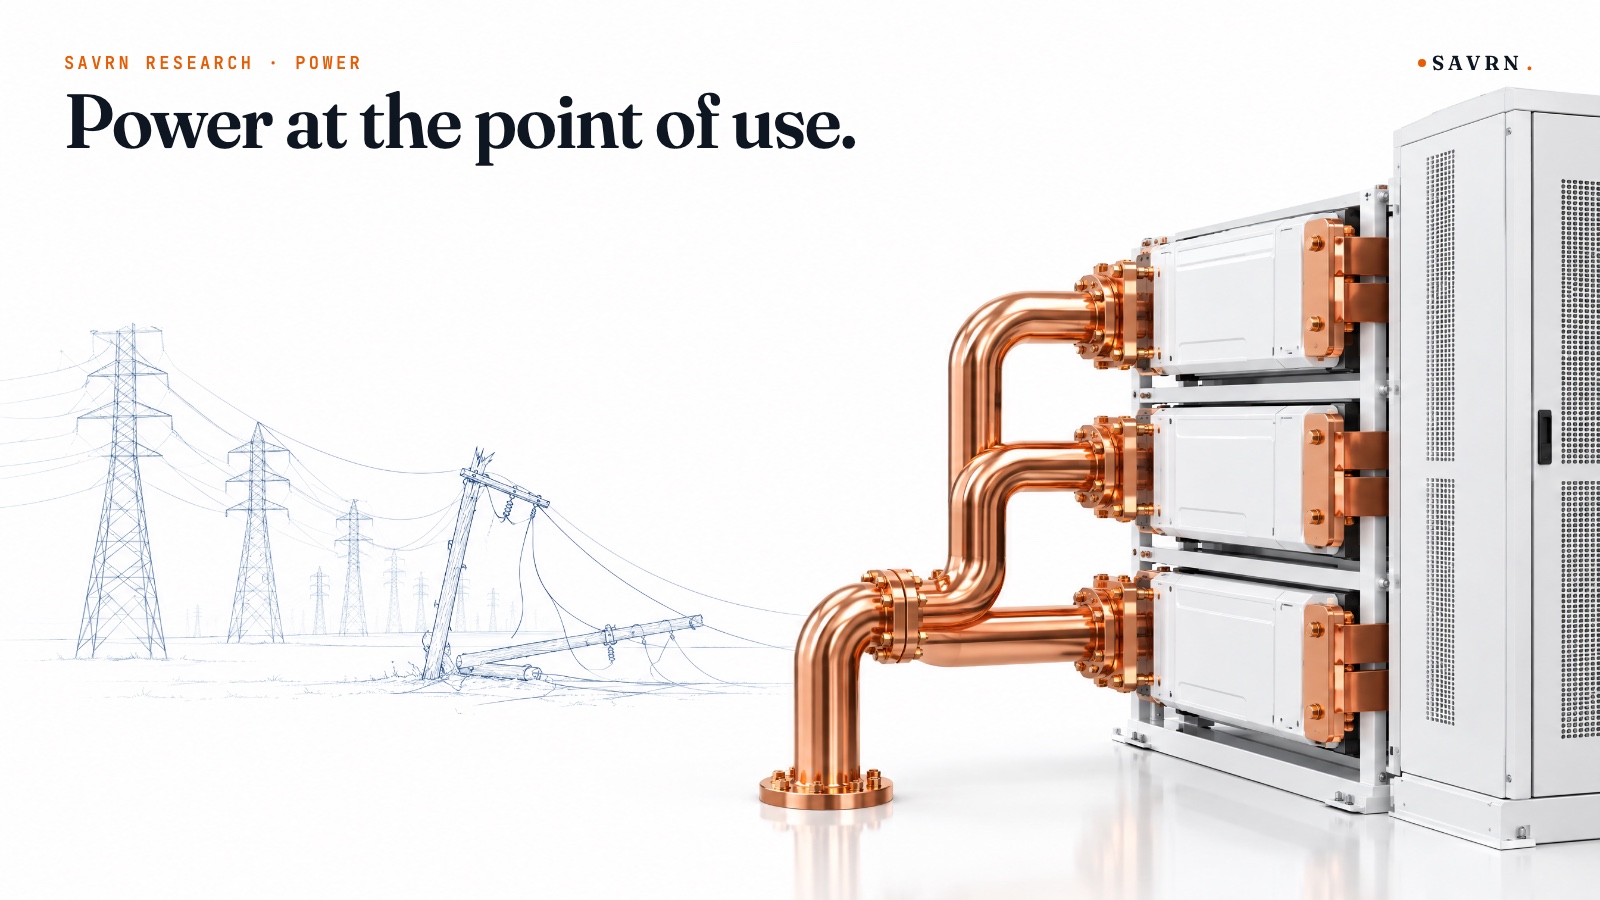
The grid puts five layers of exposed equipment between a power plant and your building. An on-site fuel cell replaces them with one buried gas line and a plant you control. Here is what twenty years of federal data say about which one keeps the lights on.
About SAVRN. SAVRN builds self-powered AI factories. Each campus makes its own baseload with Proton fuel cells, rides load swings on Ion battery storage, and cools on a sealed loop with no routine draw on community water. As a result, we wanted to know how on-site power compares with the grid, so we went through twenty years of federal data to find out.
Most people assume the grid is the dependable option and anything on site is the backup. Federal data, however, show the opposite.
In 2024 the average U.S. electricity customer spent about 11 hours without power. In fact, that was the most in the decade EIA has tracked, and nearly three times the 2014 figure. By contrast, a 2018 industry survey found gas customers lose service for about 3 minutes a year. And in our review of twenty years of federal pipeline incident reports, none described a single gas line failure cutting off a customer’s electricity.
The difference comes down to how each system reaches your building, rather than to the equipment at either end. Below we walk it link by link. Finally, we take on the one real weakness in the fuel-cell case, which is extreme cold, and show how a well-built site closes it.
What to take from this
- Grid power crosses five layers of mostly above-ground electrical equipment. An on-site fuel cell, by contrast, swaps all five for one buried gas service.
- Grid outage time nearly tripled from 2014 to 2024. Routine outages stayed flat, while storms drove the rest.
- Gas distribution customers lose service for minutes a year. In our review of federal incident reports, no single pipeline failure was reported to cut a customer’s electricity.
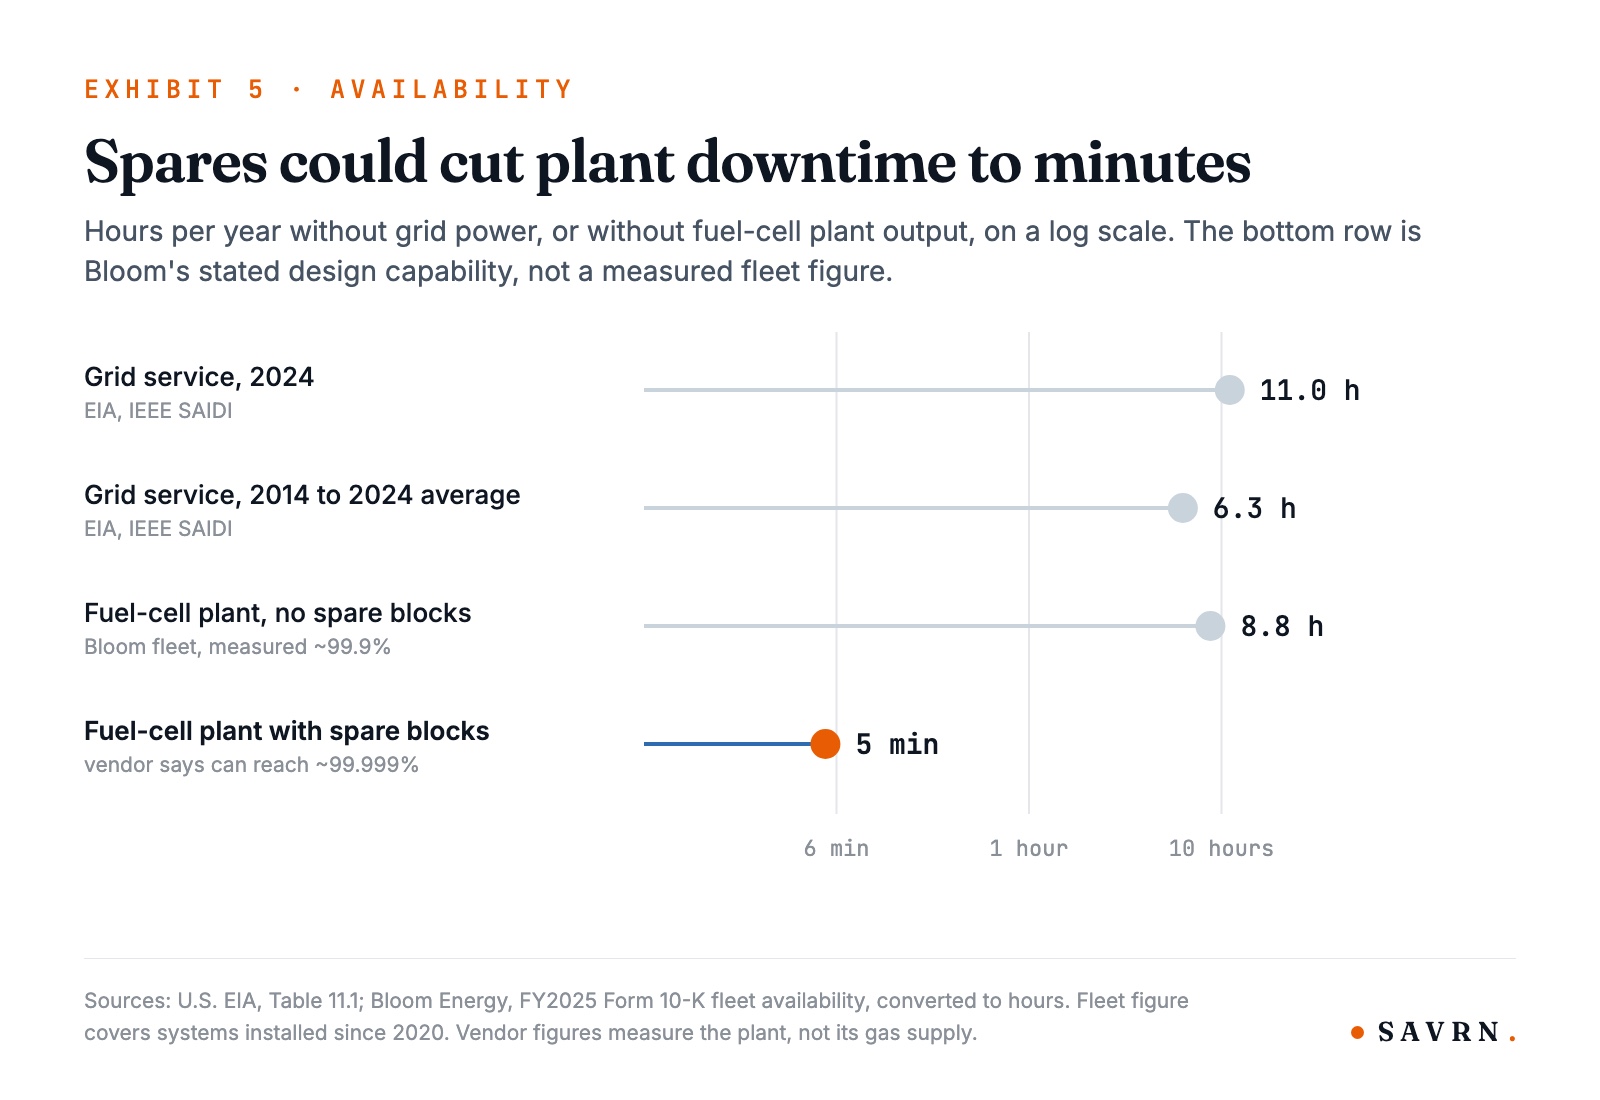
- Fuel-cell fleets measure about 99.9% available without spares. The vendor says redundancy can take that close to 99.999%, about five minutes a year.
- Extreme cold is the real risk, because it can hit gas and grid together. Grid customers already carry it, and firm gas service, a second feed and stored fuel manage it on site.
Count the links between the power plant and your building
Grid power has a long trip, since it is made far from where it is used. It leaves the plant, climbs through a step-up substation, runs over high-voltage transmission lines, drops through bulk and distribution substations, rides a distribution feeder down your street, and passes through one last transformer before it reaches the meter. Notably, most of that sits on towers and poles, out in the weather, next to trees and traffic. If any one link fails and no backup path happens to exist, the building goes dark.
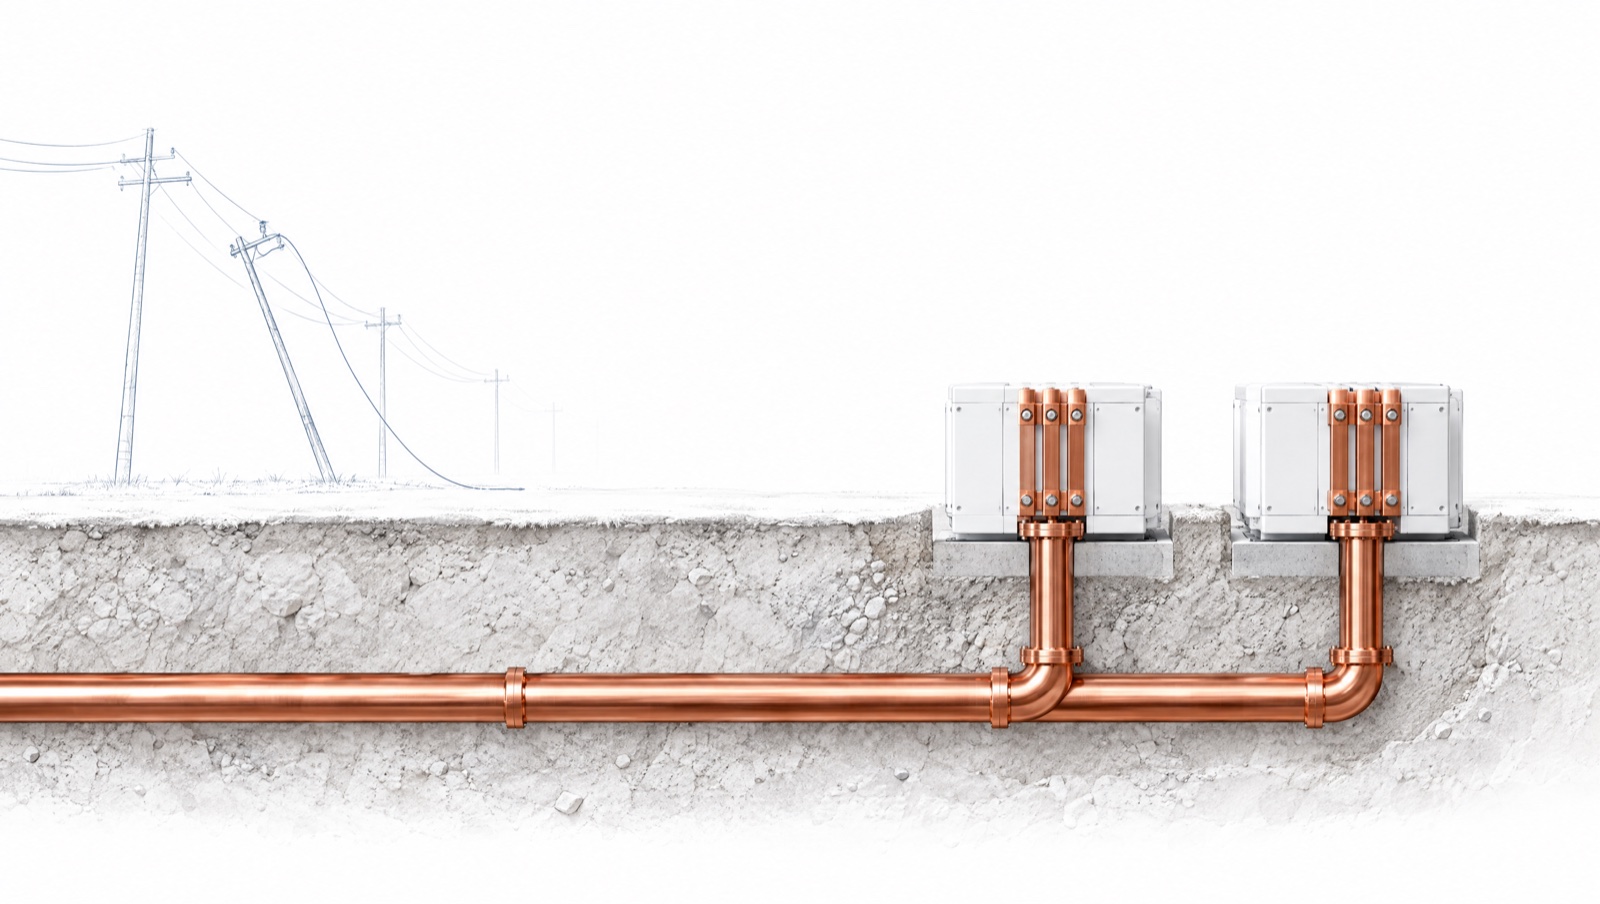
An on-site fuel cell, however, takes a different route. Gas comes up from the wells, moves through buried interstate pipelines, feeds a main under the street, and runs through a service line to your meter. From there, instead of crossing more wires, the fuel-cell plant turns it into electricity a few feet from the load it serves.
That is the core of the argument. With a fuel cell, the exposure near your site shrinks to two things: the service line and the plant itself. Both are on or beside your property, and therefore both can be engineered.
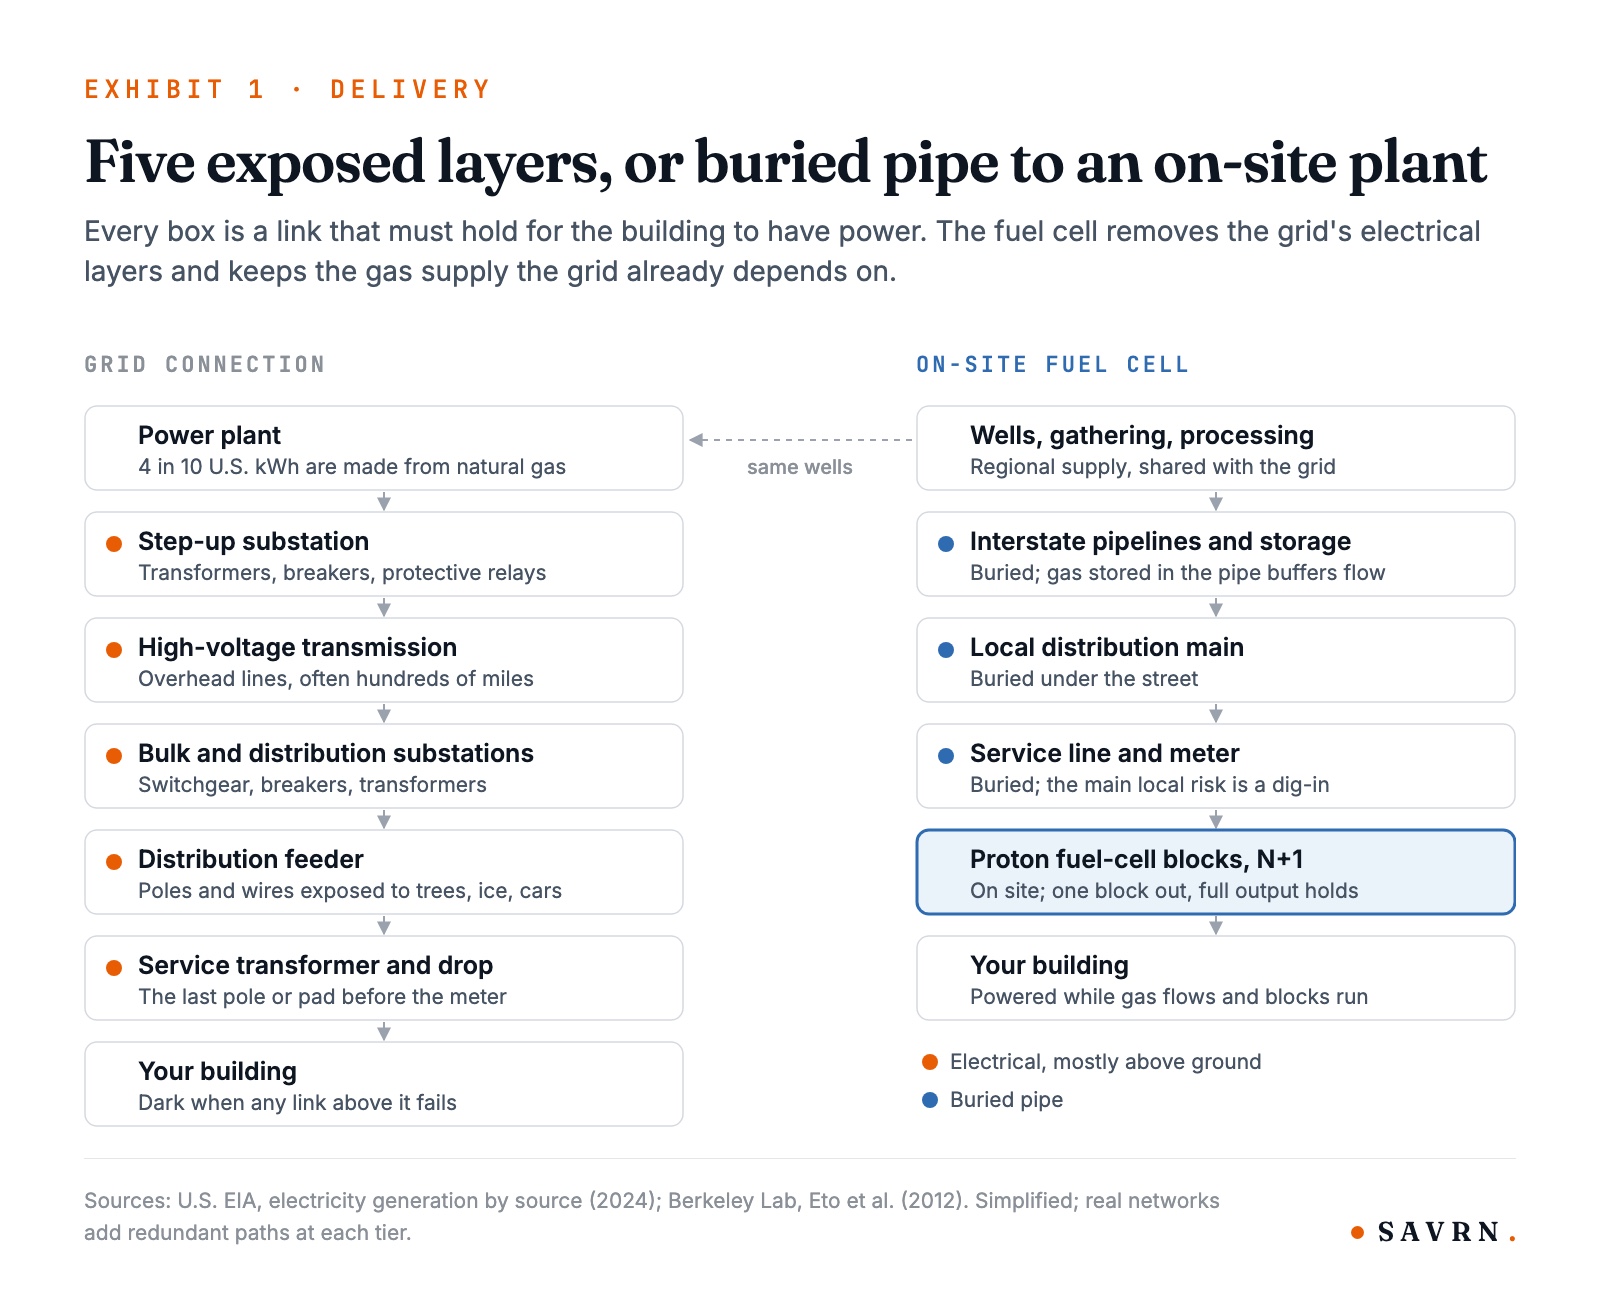
Notice where both chains begin. About 4 in 10 kilowatt-hours on the U.S. grid are made from natural gas (EIA). Therefore the regional gas risk a fuel cell takes on is not new. A grid customer already carries it, with the electrical layers stacked on top.
What the grid actually delivers
The grid, in fact, is getting less reliable, not more. EIA’s reliability data show the average customer went 3.9 hours without power in 2014 and 11 hours in 2024 (EIA Table 11.1). Major events, led by Hurricanes Beryl, Helene and Milton, caused 80% of the 2024 total (EIA).
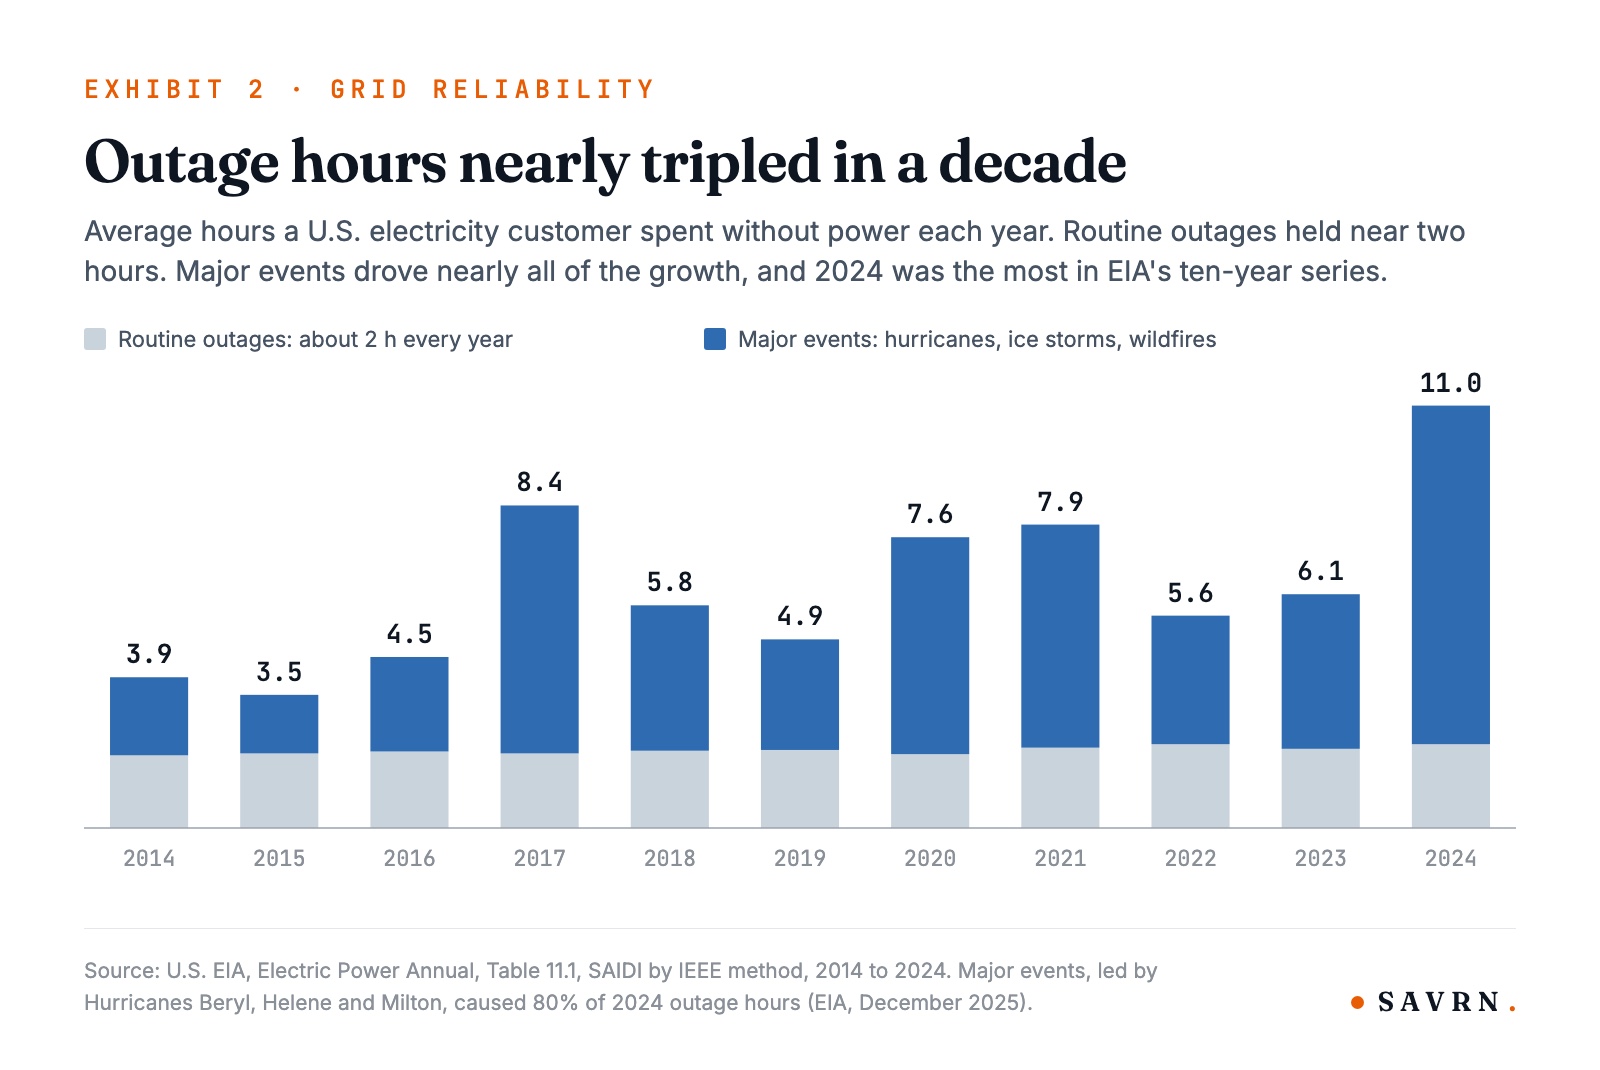
Look at the grey part of each bar. Routine outages have held near two hours a year for a decade, while major events have grown. As a result, nearly all of the growth comes from major events such as storms, ice and wildfire.
Most interruptions start close to the customer, rather than at the power plant. Berkeley Lab found that local distribution systems cause more than 90% of interruptions and about half of all outage minutes (LBNL, 2012). Transmission and generation fail less often, but when they do, they take far more customers down at once (LBNL-47043).
It adds up. Sustained outages cost U.S. customers about $44 billion a year, and commercial businesses carry 70% of it (LBNL, 2018). Meanwhile, the outlook is not better. NERC’s latest long-term assessment puts 13 of 23 North American areas at elevated or high risk of energy shortfalls over the next decade, as peak demand is projected to grow by 224 GW (NERC).
What the gas network delivers
Gas customers, by contrast, lose service far less often. In a 2018 survey of North American utilities, the Gas Technology Institute put it at about 3 minutes a year for gas, against 156 minutes for electricity (GTI, 2018).
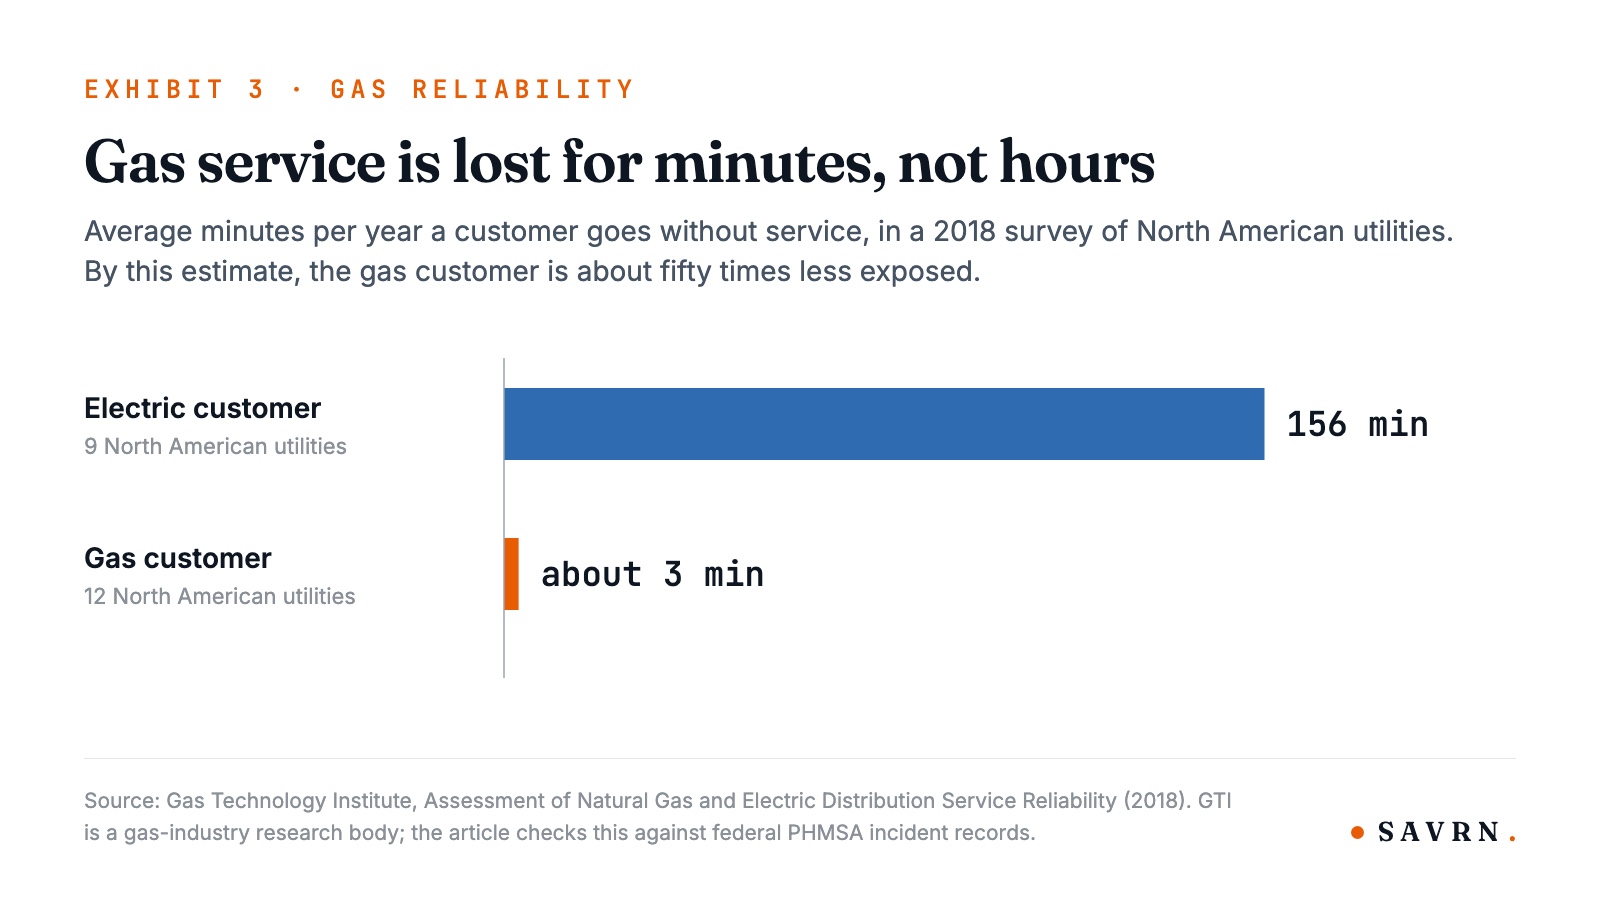
GTI is a gas-industry research group, so we checked its number against the federal record. Since 2010, pipeline operators have reported about 259,000 customer interruptions tied to incidents, across 73 million gas services (PHMSA). Specifically, that works out to roughly 0.0002 interruptions per customer per year. The electric figure for 2024 was 1.53.
The federal number is a floor, since PHMSA only records incidents above a damage threshold. However, even if the true rate were a hundred times higher, a gas customer would still be interrupted about seventy times less often than an electric one.
Now the question that matters most for on-site power. Operators filed 4,368 gas-origin incident reports from September 2006 to August 2026, across roughly 3 million miles of pipe. In our review of those reports, none described a customer losing electricity because of the incident. That includes major transmission ruptures such as Strasburg, Virginia in 2023. PHMSA forms are not built to track downstream power loss, however, so we treat this as our own finding rather than a federal statistic.
Single breaks rarely reach the meter because of physics. A pressurized pipeline holds hours of supply in the pipe itself, so a break upstream drains it slowly. Electricity, by contrast, has no such cushion. Supply has to match demand every second, and a tripped line removes supply instantly.
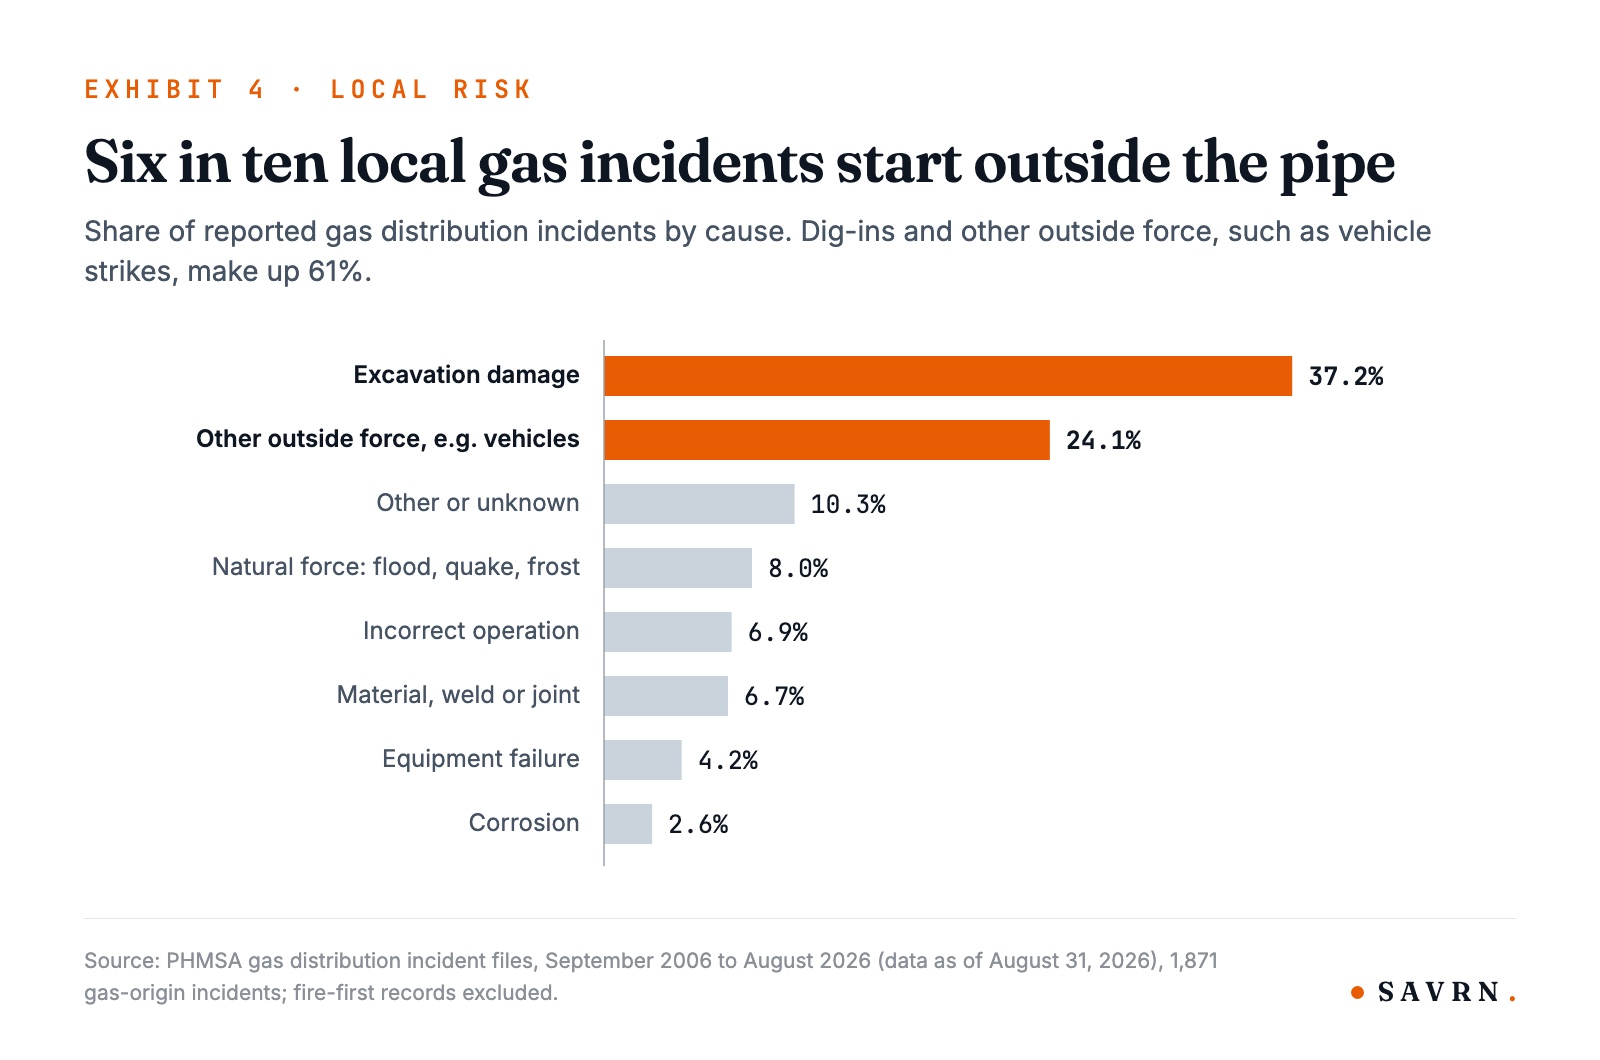
What local risk remains is mostly damage from outside the pipe, for example a backhoe or a vehicle. That is the kind of risk an owner can design against on their own property, with locate-and-mark enforcement, barriers around the meter set and a second service line.
The plant itself: why spare blocks matter
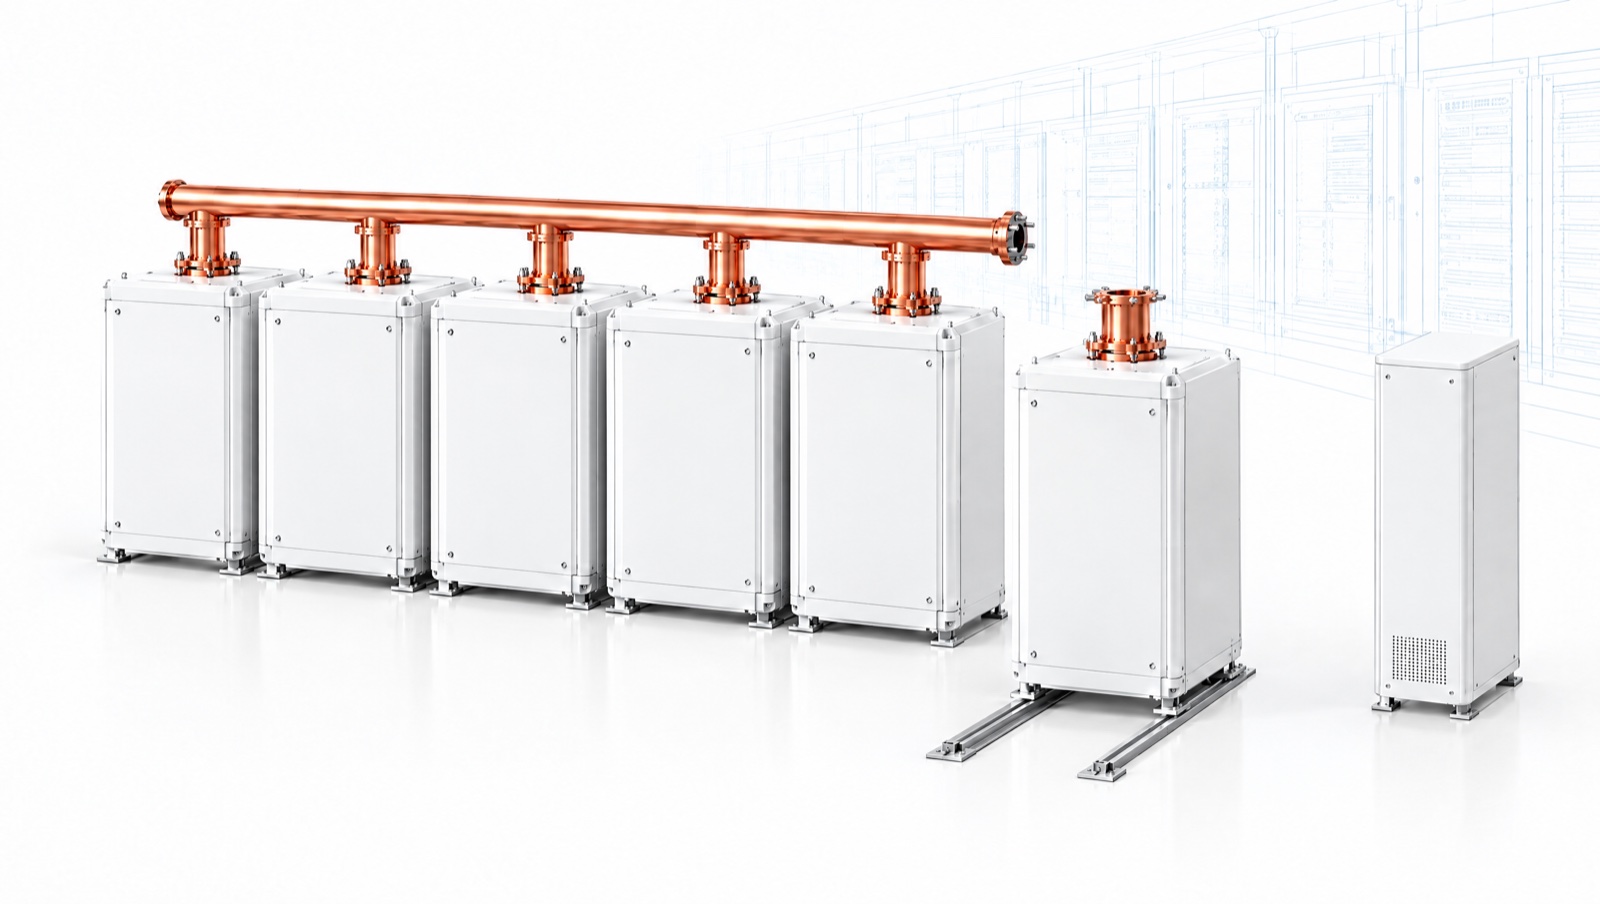
A fuel-cell plant is not one machine; rather, it is a set of independent blocks, so it can lose one without losing the site. Our Proton reference design for a 13.2 MW Atom uses six blocks of 3 MW each, five running and one spare: 18 MW installed and 15 MW firm. A block can come out for service while the factory keeps its full output, and Ion battery storage covers the fast load steps in between.
Bloom Energy reports that its fuel-cell fleet installed since 2020 has run at about 99.9% availability without redundancy. It adds that redundancy “can” bring availability close to 99.999% (Bloom 10-K). That second figure, about five minutes a year, is a design capability rather than a measured fleet record.
Similarly, a DOE-funded field test that Bloom ran in Anchorage points the same way. Two 25 kW solid-oxide modules ran on natural gas from December 2008 to December 2009, and the report puts their uptime at 99.6% and 99.7% against a 70% target (DOE/OSTI). Bloom wrote the report, and the units ran alongside the grid, so read it as a vendor measure of the hardware.
Bloom also reports that its systems powered customer facilities through more than 1,750 grid outages since 2018 (Bloom). Earlier, in 2012, the first 3 MW phase of a planned 30 MW Delmarva Power installation kept feeding the grid as Hurricane Sandy passed directly over it (Bloom). These are vendor figures, and they measure the plant rather than its gas supply. We cover the supply next.
Recent large fuel-cell agreements:
The weak spot: extreme cold
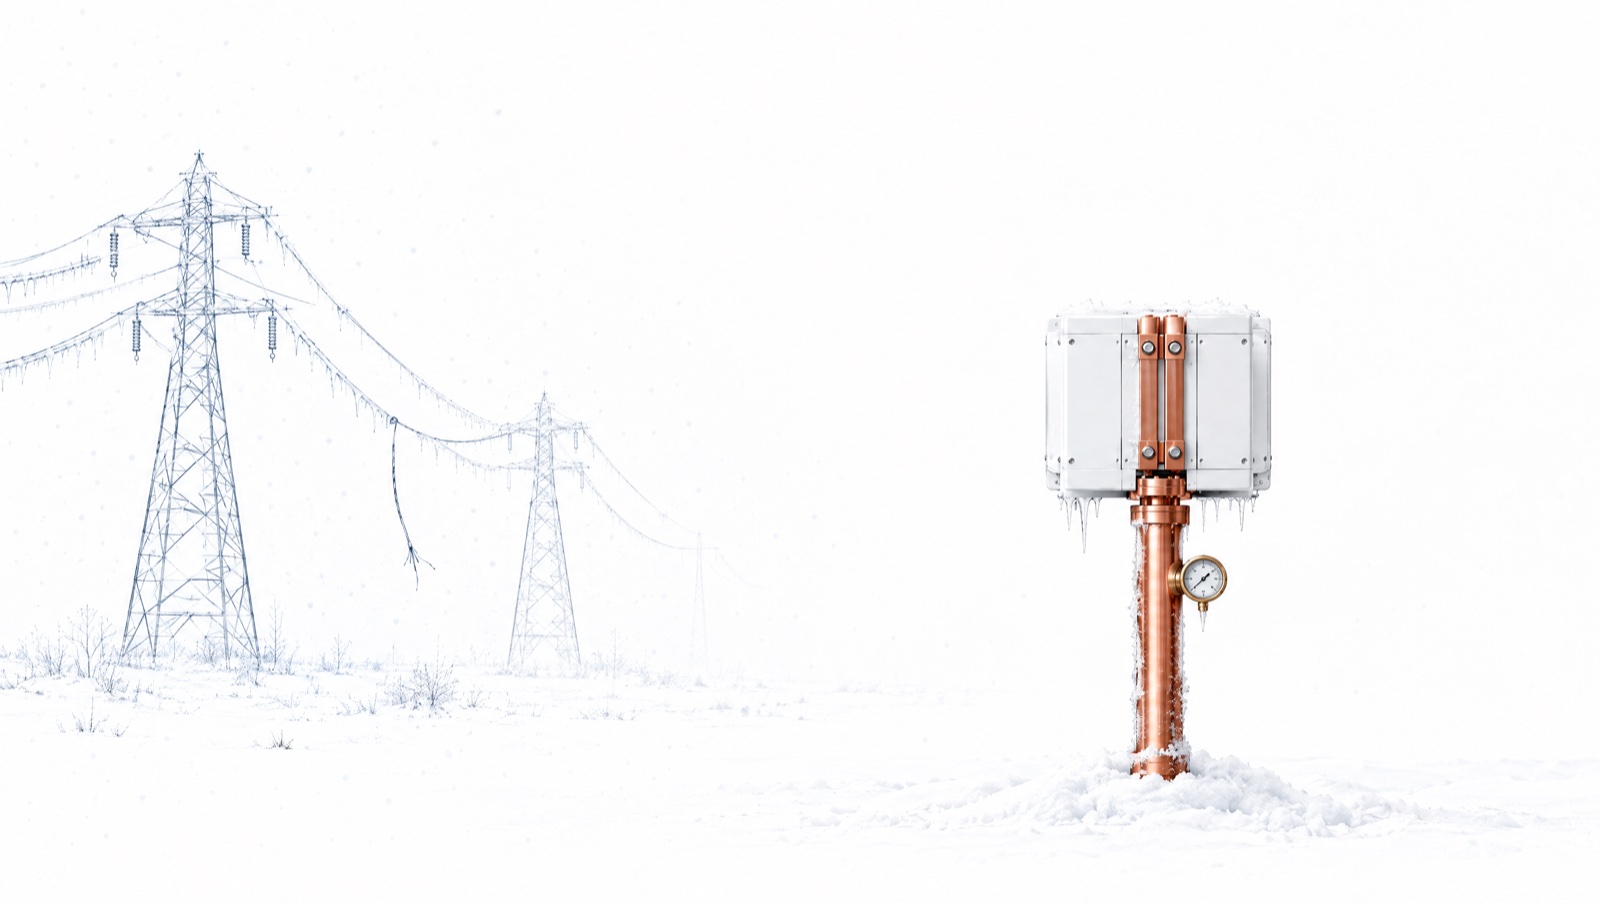
Extreme cold, however, is the one risk the gas chain shares with the grid. At least five times since 2011 (in 2011, 2014, 2018, 2021 and 2022), extreme cold hit gas production and gas-fired generation together. The three worst are below. In each of them, notably, the people who lost power were grid customers.
Gas, however, was not the only thing that failed. During Uri, frozen equipment at power plants caused 44% of unplanned generation outages, while gas supply caused about 27% (FERC/NERC). The failure also fed on itself, since blackouts cut power to gas facilities. Blackouts at wells and gathering stations caused 21.5% of the lost gas production. An on-site fuel cell draws nothing from the grid, so it does not feed that loop.
When gas runs short, it is rationed by a published priority list, and homes come first. Texas’s rule, adopted after Uri, ranks firm deliveries in this order: human needs, then electric generation, then minimum plant-protection volumes, then small commercial and industrial users. Interruptible customers come last (16 TAC §7.455). A fuel cell on firm service sits ahead of every interruptible load, including gas plants that buy interruptible transport. In addition, Texas counts distributed and backup generation registered with ERCOT as electric generation. That may lift a registered on-site plant to the second tier, which is worth confirming with the Railroad Commission for any Texas site.
In plain terms, a fuel cell on interruptible gas in Texas in February 2021 would likely have lost fuel along with the grid. One on firm service, with a second feed and fuel stored on site, turns the gas system’s only proven regional weakness into a design requirement.
How to engineer the gap closed
Every exposure left in the fuel-cell chain is on or near the site, so each one can be designed against. The grid’s exposures, by contrast, sit on someone else’s poles and in someone else’s control room.
The last row reverses the usual design. Most critical sites, for example, run on the grid and keep a diesel generator for backup. Here, instead, the fuel cell is primary and any grid tie becomes the backup. Outside a regional cold event, losing the site would take two unrelated failures in the same hour.
The bottom line
For a site that has to stay up, the data favor on-site fuel cells as the primary source. They remove the five exposed electrical layers where routine outages start and storm outages multiply. In their place, instead, is buried gas service. In our review of twenty years of pipeline incident reports, no single line failure was reported to cut a customer’s electricity. The plant itself is modular, and as a result the vendor puts a plant with spares close to 99.999% available.
The gas system’s one proven weakness, a regional shortfall in extreme cold, already threatens every grid customer. On site it becomes a design requirement: firm service, a second feed, stored fuel and a standby source. If you are weighing power for a campus, bring us the site and we will show you how Proton and Ion fit it.
Keep reading: Proton fuel-cell power, behind-the-meter AI power and the Grid Operator Watchlist.
Frequently asked questions
Is an on-site fuel cell more reliable than the grid?
For a site built with spare fuel-cell blocks and firm gas service, the data point that way. The average U.S. electricity customer went about 11 hours without power in 2024. By comparison, Bloom’s fuel-cell fleet has measured about 99.9% availability without spares, and Bloom says redundancy can bring that close to 99.999%. Because it makes power on site, the fuel cell also bypasses the transmission lines, substations and feeders where most grid outages start.
Where do most U.S. power outages start?
Close to the customer. Berkeley Lab found that local distribution systems cause more than 90% of interruptions and about half of all outage minutes. Transmission and generation fail less often, but when they do, they take far more customers down at once.
How often do gas customers lose service?
Rarely. For example, a 2018 Gas Technology Institute survey of North American utilities put it at about 3 minutes a year for gas, against 156 minutes for electricity. Federal incident reports point the same way, at roughly 0.0002 reported interruptions per gas customer per year since 2010.
What causes most gas distribution incidents?
Mostly damage from outside the pipe, rather than failures of the pipe itself. Excavation damage caused 37.2% of reported gas distribution incidents over twenty years, and other outside force, such as vehicle strikes, caused another 24.1%. As a result, locate-and-mark enforcement, barriers around the meter set and a second service line address most of the local risk.
What happens to a fuel cell if the gas goes out?
Like a gas-fired power plant, it stops making power. Therefore the design matters. Firm gas service, a second service line from a different main and fuel stored on site each cover a different way the supply could fail. Because gas service is lost for only minutes a year on average, the event is rare, but a critical site should still plan for it.
Did gas failures cause the Texas blackout in 2021?
Partly. Specifically, during Winter Storm Uri, frozen equipment at power plants caused 44% of unplanned generation outages, and gas supply problems caused about 27%, according to FERC and NERC. Blackouts also knocked out power at wells and gathering stations, which caused 21.5% of the lost gas production. Even so, 99.95% of residential gas customers in Texas kept service.
How can a site protect a fuel cell's gas supply in extreme cold?
First, choose firm, non-interruptible gas service, which ranks ahead of every interruptible load in a shortage. After that, add a second service line from a different main, fuel stored on site that the fuel-cell vendor certifies, and, where a utility tie exists, the grid as a standby source. In Texas, registered distributed generation may also count as electric generation in the state’s curtailment priority, although that is worth confirming with the Railroad Commission.
How much redundancy does a fuel-cell plant need?
At least one spare block. For instance, SAVRN’s Proton reference design for a 13.2 MW Atom uses six fuel-cell blocks of 3 MW each, five running and one spare, for 18 MW installed and 15 MW firm. Any block can therefore be serviced without touching the factory’s output, while Ion battery storage handles fast load changes and short transients.
Why pair fuel cells with battery storage?
Because each does a different job. Fuel cells run best as steady baseload, while an AI factory’s load can swing quickly. Ion, the grid-forming battery, therefore sets voltage and frequency, rides those load steps and carries the plant through a block trip, so the fuel cells never have to chase the load.
Do fuel cells qualify for federal tax credits?
Yes. Fuel-cell projects that begin construction after December 31, 2025 qualify for the section 48E clean electricity investment credit at a flat 30%, regardless of fuel. In addition, fuel cells carry no prevailing-wage or apprenticeship condition and no bonus adders.
Sources
Every figure in this piece links to the source that states it. Pipeline incident counts come from PHMSA files dated August 31, 2026. Where a figure comes from a vendor or an industry group, we say so.
Grid reliability and outage costs
- U.S. EIA, Electric Power Annual, Table 11.1: reliability metrics of U.S. distribution systems, 2014 to 2024.
- U.S. EIA, Today in Energy: u.S. customers averaged about 11 hours without power in 2024.
- U.S. EIA, electricity generation by source: natural gas share of U.S. generation.
- Berkeley Lab, Eto et al., 2012: share of interruptions that begin on distribution systems.
- Berkeley Lab, Osborn and Kawann, LBNL-47043: transmission and distribution shares of interruptions.
- Berkeley Lab, LaCommare et al., 2018: annual cost of sustained power interruptions.
- NERC, 2025 Long-Term Reliability Assessment: areas at elevated or high risk of shortfall.
Gas pipeline reliability
- PHMSA, pipeline incident data: gas distribution, transmission, gathering and storage incident files.
- Gas Technology Institute, 2018: natural gas and electric distribution service reliability. Industry research.
Fuel-cell performance and buyers
- U.S. DOE / OSTI, final report DE-FG36-05GO15195: anchorage solid-oxide fuel-cell field test, 2008 to 2009.
- Bloom Energy, FY2025 Form 10-K: fleet availability with and without redundancy.
- Bloom Energy, resilience and Delmarva after Hurricane Sandy: vendor-reported outage ride-through.
- Bloom Energy press releases on AEP, Equinix, Oracle and Brookfield.
Cold-weather events and gas priority
- FERC and NERC, February 2021 cold weather outages: winter Storm Uri inquiry.
- FERC and NERC, Winter Storm Elliott final report.
- FERC and NERC, February 2011 Southwest cold weather event.
- Railroad Commission of Texas, curtailment rule and 16 TAC §7.455: gas curtailment priorities.
Want the next one?
When a new piece publishes on SAVRN Insights, you get one email with what it covers and a link to read it. Choose the research that interests you.
Also send me
Receive a short introduction on days 3, 7 and 14, plus the updates you select. Unsubscribe in one click. Privacy
On-Site Fuel Cells vs. the Grid: 20 Years of Reliability Data
Get new SAVRN Insights by email
A short introduction on days 3, 7 and 14, plus new SAVRN research articles. Unsubscribe at any time.
We use your address to send the introduction and updates described above. See our Privacy Policy.