The US Data Center Map: Every Facility We Can Name
4,761 data centers, sourced from primary records, joined to every policy tracker SAVRN keeps. By state. By operator. No side taken.
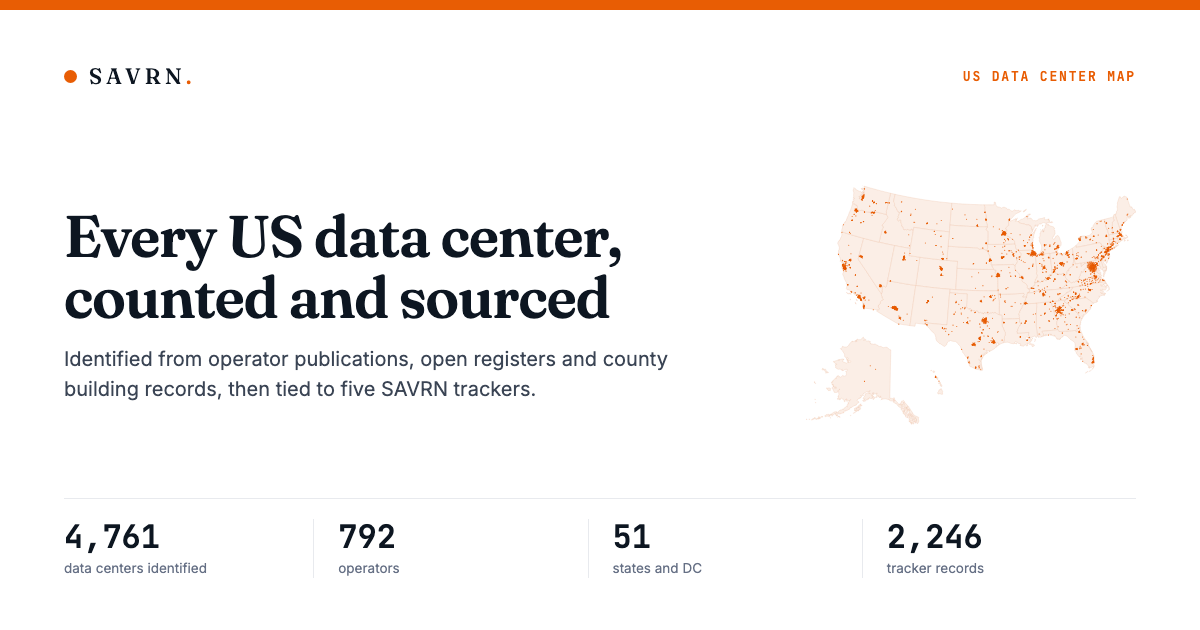
There is a number that gets repeated in every argument about data centers without anyone checking it: how many actually exist in the United States. SAVRN built a map to answer that question from primary sources, then tied the answer to five trackers it already keeps: which states and counties have paused construction, what water rules apply, which grid operator serves each site, what is delayed, and what capital has been committed. The map takes no side in any of those arguments. It states the record, by state and by operator, including what it does not yet know.
One record, five trackers
The US Data Center Map identifies 4,761 data centers from primary sources: operator location pages, county building registers, PeeringDB, OpenStreetMap and Wikidata. That is checked against 4,767, a commercial directory’s own published count for the country and the industry’s standard reference figure, not SAVRN’s.
Every one of those 4,761 buildings is joined to five trackers SAVRN keeps as its own primary-sourced record:
- The Data Center Moratorium Tracker: 68 state measures and 280 local pauses.
- The Data Center Water Tracker: 90 federal, state and local water measures.
- The Grid Operator Watchlist: the dominant RTO or ISO for every state and DC.
- The Delay Watchlist: 224 named projects, 658 county and city restrictions, 229 utility dockets, 39 lawsuits.
- The Capital Atlas: 159 named sites with announced capital, and 127 projects blocked, delayed or halted.
That is 2,246 tracker records in total and 6,624 links from a specific facility to a specific record about the place it stands. Click a data center on the map and its moratorium status, water rule, grid operator and nearby delayed projects are already attached to it. Nothing on the map argues for or against any of it. It states what is on record and where.
By state
Every state and DC has its own page at the map, and the state-by-state count is where it gets interesting. Nationally, the total lands close to the reference figure: 4,761 identified plus 150 planned or under-construction sites is 4,911, or 103 percent of the industry’s 4,767.
That agreement is close to accidental. Twenty-six states are short of their reference figure by 470 combined. Twenty-five run over by 615 combined. Virginia is the clearest case: the map places 825 buildings there against a reference figure of 674, largely because Northern Virginia counties publish permitted data centers as an open map layer that names buildings a commercial count appears to treat as fewer, larger listings. California runs in the same direction. Pennsylvania, Texas, Ohio and Indiana run the other way, short by a combined 221 against the reference figures for those four states.
The national percentage is not the number worth trusting. The state-by-state ledger is, and it sits on the page for every state, sorted by the size of the gap.
By operator
The map also names 839 operators. 203 of them run enough buildings to earn a page of their own: what the company does, and every building it runs, by state and by city.
What a company does is not guessed from the shape of its data. An earlier pass inferred it from facility statistics and called any operator with PeeringDB network records present in its buildings an “interconnection” business. That produced 71 of the 203 companies labeled interconnection, and it was wrong. Networks are present in nearly every colocation building; presence is not a business model. Every one of the 203 companies was instead read on its own site and classified by what it says about itself, then checked a second time by an independent pass trying to disprove the label before it shipped. The number of companies whose stated core product is genuinely the meet-me-room itself is six.
The rest split across colocation, wholesale leasing, network carriers, cloud platforms, site developers, hosting providers, bitcoin miners converting to AI compute, and enterprise operators such as universities running facilities for their own use.
What the record does not know
Disclosure is uneven, and the map does not smooth it over. Of the 4,761 buildings, 1,632 publish a floor area and 990 publish a power figure. A further 812 have only a footprint measured from their mapped outline, which is not the same measurement as floor space. None of those figures is summed into a headline total, because a floor area for one hall and an announced campus capacity are not comparable even when the unit looks the same.
If an operator is missing, that is usually because no public record describes it yet, not because it does not exist. The map states every source it reads and every source it declined to use, including sources that would have closed the remaining gap immediately at the cost of copying a proprietary directory’s own listings, which its terms forbid and which the map does not do.
The record, not the argument
The full map is at savrn.com/data-center-map, with a page for every state, a page for every operator that clears the threshold, and a methodology section stating exactly what each figure means and does not mean. It exists so a reporter, a regulator, a resident or a competitor has one place to get a number and check it, regardless of which side of the data center argument they are on. Where a source is wrong or a building is missing, the map names its sources so the correction can be checked the same way the figure was.
Want the next one?
When a new piece publishes on SAVRN Insights, you get one email with what it covers and a link to read it. Choose the research that interests you.
Also send me
Receive a short introduction on days 3, 7 and 14, plus the updates you select. Unsubscribe in one click. Privacy
The US Data Center Map: Every Facility We Can Name
Get new SAVRN Insights by email
A short introduction on days 3, 7 and 14, plus new SAVRN research articles. Unsubscribe at any time.
We use your address to send the introduction and updates described above. See our Privacy Policy.