Total Compute Spent on AI Inference in 2025: Dollars, Terawatt-Hours, and Share of the Fleet
There is no single audited figure: AI infrastructure spending hit $318 billion in 2025, inference took roughly half of all AI compute, and data centers used 485 TWh of electricity worldwide.

There is no single audited number for the total compute spent on AI inference, because “compute spent” is measured three different ways: dollars, electricity, and share of the accelerator fleet. In 2025 the best-sourced answers are $318 billion of global AI infrastructure spending ([1]), of which inference accounted for roughly half of all AI compute ([2]); 485 TWh of total data center electricity ([3]), although no agency publishes an inference-only split; and inference at 55% of AI-optimized cloud infrastructure spend in 2026 ([4]). Accordingly, this article separates the three measures, gives the range and methodology behind each estimate, and adds the 2026 disclosures from hyperscaler filings, NVIDIA, the IEA, and EPRI.
What “total compute spent on AI inference” actually measures
The phrase conflates three quantities that move on different scales and are tracked by different institutions.
Dollars. Capital expenditure on servers, accelerators, networking, and buildings, plus operating spend on inference services (API tokens, AI-optimized cloud instances). Tracked by IDC, Gartner, Deloitte, Menlo Ventures, and the hyperscalers’ own 10-K and 10-Q filings.
Electricity. Terawatt-hours (TWh) consumed by the servers running inference, or gigawatts (GW) of installed capacity allocated to it. Tracked by the IEA, Lawrence Berkeley National Laboratory (LBNL), EPRI, Schneider Electric, and McKinsey.
Share of compute. The fraction of AI accelerator capacity, FLOPs, or vendor revenue devoted to inference rather than training. Tracked by NVIDIA (through earnings-call commentary), Epoch AI, Deloitte, Gartner, and sell-side research.
In fact, each institution defines “AI” and “inference” differently, and none publish a reconciled figure. Specifically, the sections below report each estimate with its date, method, and range. Finally, where a number is derived arithmetically from a source’s published figures, it is labeled as such.
How much money was spent on AI inference infrastructure in 2024 and 2025?
First, global AI infrastructure spending (servers and storage for AI workloads) was $153 billion in 2024 and $318 billion in 2025, and IDC forecasts $497 billion for 2026, $1.08 trillion for 2029, and ultimately $1.21 trillion for 2030 ([1]). Specifically, servers were 97.6% of the Q1 2026 total ($87.6 billion of $89.7 billion), while the United States was 75.7% of global spend ([1]). Notably, IDC does not split this figure between training and inference.
Gartner’s broader definition of AI infrastructure, which instead includes AI-optimized IaaS, servers, network fabric, semiconductors, and AI devices, was $975.6 billion in 2025 and is forecast at $1.43 trillion in 2026, within total AI spending of $1.76 trillion and $2.60 trillion respectively ([5]). As a result, the device inclusion is why Gartner’s figure is roughly three times IDC’s.
Meanwhile, Deloitte estimates AI data center capex at $300 billion to $400 billion in 2025 and $400 billion to $450 billion in 2026, with chips accounting for $250 billion to $300 billion of the 2026 total, rising toward $1 trillion in 2028 ([2]). Additionally, the same report puts revenue for inference-optimized chips at more than $20 billion in 2025 and $50 billion or more in 2026.
By contrast, the narrowest and most explicitly inference-labeled dollar figure is Gartner’s AI-optimized IaaS forecast. Spending was $18.3 billion in 2025 and was first projected at $37.5 billion for 2026 in October 2025 ([6]); the August 2026 update subsequently raised 2026 to $42 billion (+96%) and 2027 to $66 billion, with inference at $23.3 billion versus $19 billion for training in 2026, a 55% share rising to 59% in 2027 ([4]).
On the supply side, NVIDIA’s Data Center revenue was $193.7 billion in fiscal 2026 (ended January 25, 2026) ([7]) and $89.0 billion in the single quarter ended July 26, 2026 ([8]). Notably, NVIDIA last quantified inference share in August 2024, when it estimated inference drove more than 40% of trailing-four-quarter Data Center revenue ([9]). However, no updated percentage has been given since.
Hyperscaler capex 2024 to 2026: what the filings show
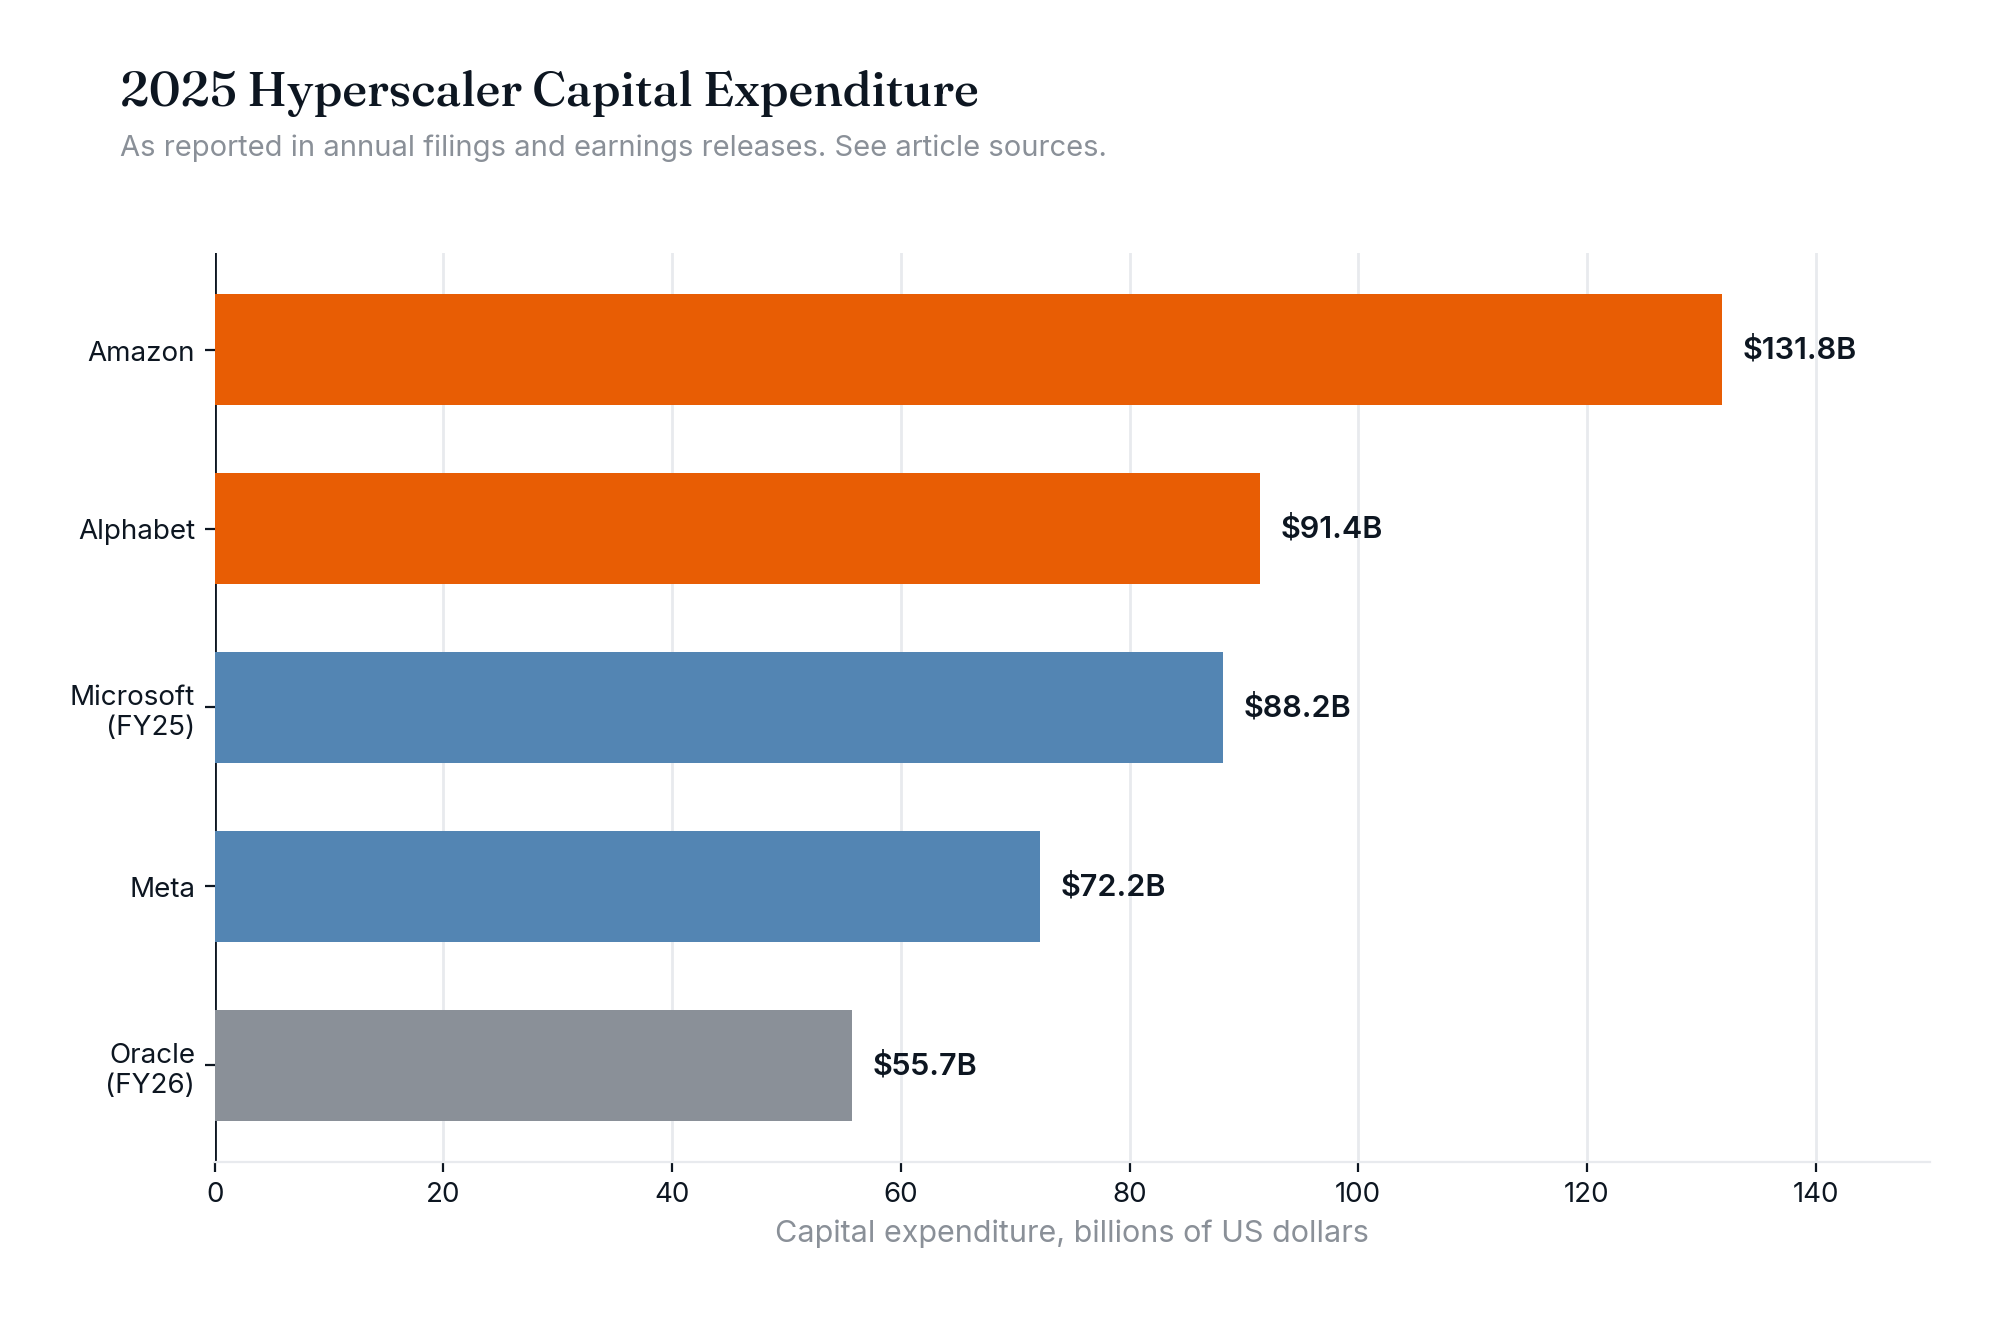
Specifically, the five largest buyers of AI infrastructure disclosed the following capital expenditures. Amounts are as reported; Microsoft’s fiscal year ends June 30 and Oracle’s ends May 31.

Calendar 2026 approximately $175B after lease reclassification, down from a $190B figure in April 2026 ([20])
“Roughly two thirds of our capex was for short-lived assets, primarily CPUs and GPUs” (Q4 FY26)

Raised from $175–185B in February and $180–190B in April ([23])
“Vast majority of the spend in technical infrastructure to support our investments in AI,” roughly 60% servers, 40% data centers and networking (Q2 2026)

Raised from about $200B in February ([25])
“Seminal opportunities like AI, chips, robotics, and low earth orbit satellites”; increase attributed to memory prices and AWS demand

Narrowed from $125–145B ([27])
Growth “driven by increased investment to support our Meta Superintelligence Labs efforts and core business”

Plus $20–25B in component prepayments ([29])
RPO of $638B; “prepaid and customer supplied hardware portions of our large AI contracts now total $75 billion”
Amounts as reported; fiscal years vary by company. Sums and comparisons in the text above are computed across these five rows.
Summing the 2025 actual columns gives roughly $439 billion across the five companies (arithmetic on the figures above, mixing fiscal and calendar years). Their 2026 guidance midpoints sum to roughly $800 billion. Notably, none of the five discloses an inference-versus-training split of capex. The closest proxies are Microsoft’s two-thirds short-lived asset share and Alphabet’s 60% server share, both of which cover training and inference hardware alike.
Analysts attribute the majority to AI. Deloitte’s $400 billion to $450 billion global AI data center capex estimate for 2026, however, sits below the five-company guidance sum, which indicates that either Deloitte’s definition excludes general-purpose cloud capacity or that 2026 spend has run ahead of the November 2025 forecast ([2]). In addition, Morgan Stanley estimates nearly $3 trillion of AI-related infrastructure investment through 2028, with more than 80% still ahead as of March 2026 ([30]).
How much electricity does AI inference consume?
Similarly, no government or intergovernmental agency publishes an audited inference-only electricity figure. What exists instead is total data center consumption from the IEA, LBNL, and EPRI, plus modeled training-versus-inference splits from LBNL, Schneider Electric, and McKinsey.
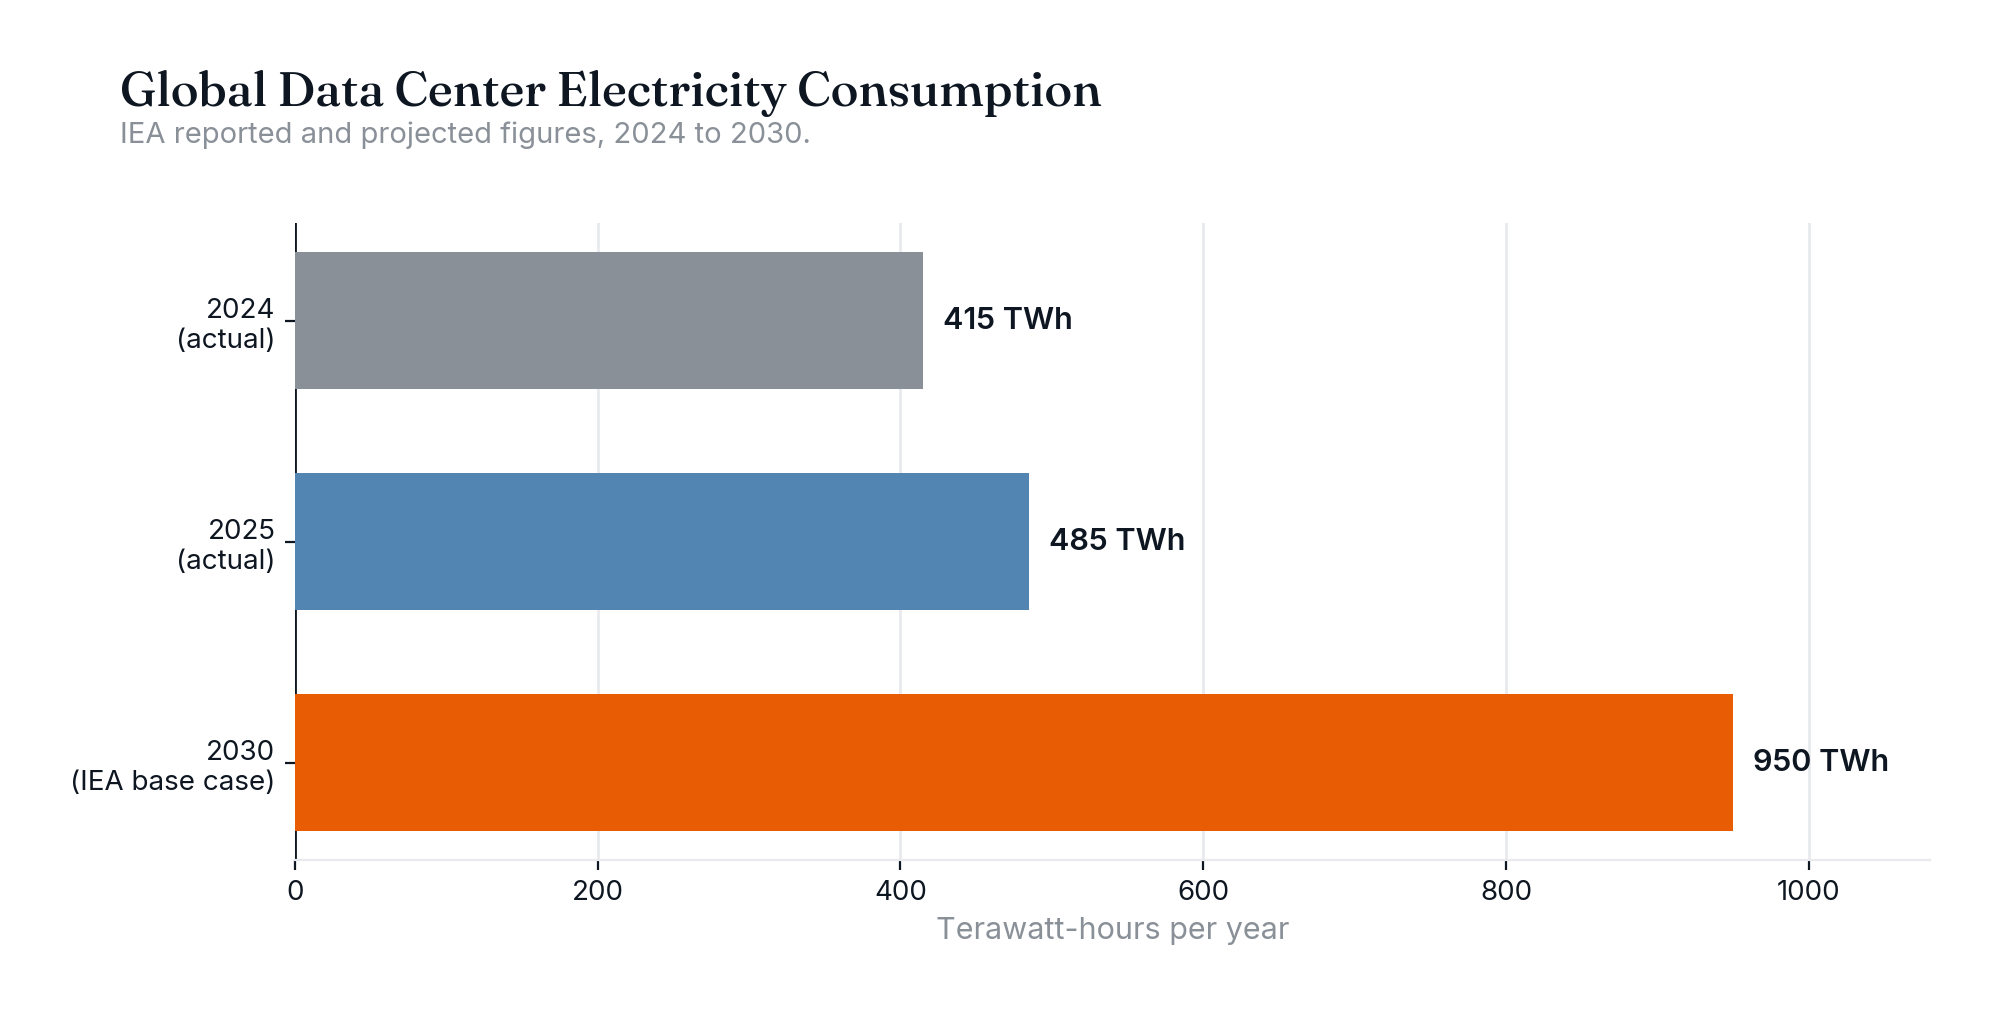
Global data center electricity consumption was 415 TWh in 2024, about 1.5% of global demand ([31]), and 485 TWh in 2025, a 17% increase, while consumption from AI-focused data centers was up 50% in the year ([3]). Furthermore, the IEA projects 950 TWh by 2030, around 3% of global electricity, with AI-focused consumption tripling over 2025 to 2030. Notably, the IEA does not separate training from inference.
For the United States specifically, LBNL’s bottom-up model put total data center consumption at 176 TWh in 2023 (4.4% of US electricity), while GPU-accelerated AI servers grew from under 2 TWh in 2017 to more than 40 TWh in 2023 ([32]). The report states that “most AI servers are allocated to inferencing throughout the entire period, and these servers make up nearly 60% of the AI server energy usage in 2023.” Applied to the 40 TWh figure, that implies roughly 24 TWh of US inference server electricity in 2023 (arithmetic on LBNL’s figures rather than a published value). LBNL projects US data center consumption of 325 to 580 TWh by 2028 (6.7% to 12.0% of US electricity), while its 2025 Update raises the 2030 estimate to 11.8% (range 9.5% to 15.3%) ([33]).
Likewise, EPRI’s February 2026 update estimates US data center consumption at 177 to 192 TWh in 2024 (4% to 5% of demand), peak load of 21 to 22 GW, and nominal IT capacity of 35 to 44 GW, growing to 380 to 790 TWh by 2030 (9% to 17%) ([34]). EPRI, however, does not publish an inference split.
Schneider Electric’s system-dynamics model instead uses a 100 TWh global AI electricity baseline for 2025 and projects 510 to 880 TWh by 2030 across scenarios, with generative AI inferencing becoming “the primary driver of electricity consumption within the AI sector by 2027-2028” ([35]; figures as reported by [36]).
McKinsey’s capacity model, expressed in GW rather than TWh, puts AI inference at 20.9 GW and AI training at 23.1 GW of 82.3 GW total data center demand in 2025, growing to 93.3 GW inference and 62.2 GW training of 219 GW in 2030 ([37]). One GW running at full load for a year is 8.76 TWh; consequently, 20.9 GW is an upper bound of about 183 TWh of annual inference electricity before utilization is applied (arithmetic rather than a McKinsey figure).
Table: AI inference electricity estimates by source
Accordingly, two conclusions follow. First, the only inference-specific TWh figures are modeled, not metered, and they rest on utilization assumptions (LBNL’s 40% inference operational time is the most explicit). Second, sources disagree on direction: LBNL has training overtaking inference in US server energy by 2028 because training gets the highest-TDP GPUs, while McKinsey and Schneider have inference becoming the dominant AI load by 2027 to 2030.
What share of AI compute goes to inference versus training?
Share estimates cluster between 40% and 60% for 2024 to 2025 and rise to 55% to 85% by 2026 to 2030, although the range depends on whether the metric is vendor revenue, cloud spend, installed power, or FLOPs.
In particular, three methodological points explain the spread. Revenue-based shares (NVIDIA) measure what buyers say hardware is for at purchase time, while the same GPU can serve training and inference over its life. By contrast, energy-based shares (LBNL, McKinsey) depend on assumed utilization and TDP allocation. Meanwhile, spend-based shares (Gartner) capture only cloud-rented capacity, a small fraction of the $318 billion IDC total.
The Epoch AI figures also show why “frontier lab” and “industry” shares differ. Global installed AI compute reached roughly 20 million H100-equivalents sold by end-2025, tripling during the year, while OpenAI alone held 10% to 15% of operational supply ([41]). Consequently, a lab that spends 30% on inference is not representative of hyperscalers and enterprises, whose fleets run production workloads.
Industry sector distribution of AI inference expenditures for 2023 and 2024
Importantly, no public dataset reports AI inference expenditures by industry sector for 2023 or 2024. In fact, IDC and Gartner sell such breakdowns in paid spending guides, but their public releases report by buyer type and region, not by vertical, and do not isolate inference. Instead, what is publicly available is enterprise generative AI spend by department and by stack layer from Menlo Ventures, plus IDC’s buyer-type shares.
Menlo Ventures’ survey of 600 enterprise IT decision-makers put enterprise generative AI spending at $2.3 billion in 2023 and $13.8 billion in 2024, excluding chips and cloud compute but including inference at that time ([44]). Subsequently, the 2025 edition restated those years to $1.7 billion and $11.5 billion after removing inference and model serving, and reported $37 billion for 2025 ([45]). The difference between editions, about $0.6 billion for 2023 and $2.3 billion for 2024, is thus the closest public proxy for enterprise-purchased inference and model serving in those years (arithmetic on the two reports; Menlo does not publish it as a standalone figure).
Source: [44]. Importantly, shares are of enterprise generative AI investment, not of inference specifically.
By stack layer in 2025, Menlo reports $19 billion to applications, $12.5 billion to foundation model APIs, $4.0 billion to model training infrastructure, and $1.5 billion to AI data infrastructure ([45]). Because foundation model API spend is inference by construction, $12.5 billion is a defensible lower bound for enterprise API-based inference purchases in 2025.
By buyer type, hyperscalers, cloud service providers, and digital service providers accounted for 86.7% of AI infrastructure spend in Q2 2025, and 84.1% of that infrastructure was deployed in cloud and shared environments ([46]). By region, the United States was 76% of Q2 2025 spend, China 11.6%, Asia-Pacific and Japan 6.9%, and EMEA 4.7%. Ultimately, this is the sector distribution that exists: it is a distribution across infrastructure buyers, not across the industries that consume inference.
Why is the inference share of AI compute rising?
Specifically, three documented drivers account for the shift: reasoning models, agentic workloads, and the resulting growth in token volume that outpaces hardware supply.

First, reasoning models multiply tokens per task. NVIDIA’s CEO stated in May 2025 that “reasoning is compute intensive, requires hundreds to thousands of times more tokens per task than previous one-shot inference” and that “reasoning models are driving a step function surge in inference demand” ([47]). In particular, Deloitte estimates that long-thinking inference can require more than 100 times the compute of a simple query ([2]).
Second, token volumes confirm the multiplier. Google’s monthly token processing rose from 9.7 trillion in May 2024 to 480 trillion in May 2025 and 3.2 quadrillion in May 2026 ([48]); its model APIs processed about 22 billion tokens per minute in Q2 2026, up from 16 billion the prior quarter ([23]). Likewise, Microsoft processed more than 100 trillion tokens in its March 2025 quarter, five times the prior year ([47]). Ultimately, Goldman Sachs projects a 24-fold increase to 120 quadrillion tokens per month by 2030 as agents scale ([49]).
Third, demand is outrunning supply. Epoch AI’s bottom-up model of global inference capacity finds supply growing 3 to 4 times per year while token demand grows roughly 10 times per year ([50]). In fact, falling unit costs do not close the gap: semiconductor providers are cutting cost per token 60% to 70% per year ([49]), and NVIDIA states Vera Rubin delivers 30 times the throughput per megawatt and 35 times lower token cost than Grace Blackwell Ultra ([51]), yet Alphabet reports it “continue[s] to be supply constrained.” This is the dynamic covered in The Inference Paradox: cheaper tokens increase total inference spend rather than reducing it.
What rising inference share means for data center design
Inference and training impose different requirements on power density, utilization, siting, and asset life.
Density. For instance, McKinsey characterizes training racks at 100 to 200 kW or more, reaching up to 1 MW, versus inference racks at 30 to 150 kW ([52]). Similarly, the IEA reports AI server power density rose 11 times between 2020 and 2025 and is set to rise a further fourfold by 2027 ([3]). As a result, rack-scale liquid cooling is the design consequence.
Utilization. LBNL models training servers at 80% operational time and inference servers at 40% ([32]). As a result, inference demand follows user traffic, which means an inference fleet sized for peak load spends most hours below it. Consequently, facilities that can flex power and run mixed workloads recover that stranded capacity.
Latency and siting. Training tolerates roughly 100 milliseconds of latency and can be sited remotely near cheap power; inference, by contrast, is sited in metropolitan areas close to users ([52]). Consequently, Schneider projects the AI central-to-edge split moving from 95/5 in 2023 to 50/50 by 2028 ([38]). Because of that geography, distributed sites and behind-the-meter generation follow.
Power volatility. The IEA notes that “AI training and model use induce large and rapid power swings,” projects 20 to 25 GW of battery storage in data centers by 2030, and tracks 15 to 27 GW of onsite natural gas by 2030, mostly in the United States, with gas plants overbuilt 30% to 70% relative to demand for reliability ([3]). Similarly, Goldman Sachs expects data center power demand in the US to reach about 108 GW by 2030 ([39]).
Asset life and cost per token. Microsoft states two thirds of its capex is short-lived assets depreciated over six years, while buildings now carry 25-year lives ([53]). NVIDIA’s CEO put total data center investment at about $60 billion per gigawatt, up from about $30 billion five years ago ([51]). At that price, therefore, tokens produced per watt is the metric that determines whether an inference site earns a return; the measurement standard is covered in Tokens per Watt per Dollar.
What the 2026 disclosures add to the 2025 picture
In fact, the 2026 data points are directionally consistent: spending, electricity, and inference share are all higher than 2025 forecasts assumed.
- Capex. Alphabet raised 2026 guidance twice, to $195 billion to $205 billion; Amazon to about $220 billion; Meta to $130 billion to $145 billion; Microsoft reports about $175 billion for calendar 2026 after lease reclassification; Oracle guided $70 billion plus $20 billion to $25 billion in prepayments for FY27 (sources in the capex table above).
- NVIDIA. Q2 FY2027 revenue was $96.2 billion (+106%) while Data Center revenue was $89.0 billion (+117%), with hyperscale customers at $49 billion and neocloud, industrial, enterprise, and sovereign customers at $40 billion; Q3 guidance is $108 billion ([8]; [51]). The company stated that “global VC funding in AI, roughly 70% of which is spent on compute, exceeded $400 billion in the first half of 2026.”
- IDC. Q1 2026 AI infrastructure spend was $89.7 billion (+33.1%); the 2026 forecast was raised to $497 billion; ARM-based rack-scale systems overtook x86 in accelerated servers in Q4 2025 ([1]).
- Gartner. AI-optimized IaaS 2026 forecast raised from $37.5 billion to $42 billion; inference passes training in 2026 at 55% ([4]).
- IEA. 2025 data center consumption of 485 TWh (+17%); AI-focused consumption +50%; central 2030 projection of 950 TWh nevertheless unchanged from the April 2025 report ([3]).
- EPRI. 2030 US range raised to 380 to 790 TWh ([34]).
- Epoch AI. Token demand growing ~10x per year against 3 to 4x supply growth ([50]).
Ultimately, the unresolved gap is the same as in 2025: no primary source has published a metered, inference-only electricity or dollar figure. Every inference share in this article is an estimate, and the ranges should be carried forward rather than collapsed to a point.
How SAVRN builds for this
The data above describes an inference fleet that runs at roughly 40% utilization, needs 30 to 150 kW racks close to users, faces power that is scarce and volatile, and costs on the order of $60 billion per gigawatt. Accordingly, SAVRN’s AI factory design responds to each constraint directly.
The Atom is a factory-built, liquid-cooled compute block sized for the inference rack densities McKinsey and the IEA describe, so capacity is added in repeatable units rather than in multi-year campus phases. The Electron power system supplies the site behind the meter, which removes the grid interconnection queue that the IEA and Goldman Sachs identify as the binding constraint and provides the fast-ramping supply that AI load swings require; the approach is documented in Behind-the-Meter AI Power. Additionally, cooling is water-free, which matters for the metropolitan siting that inference latency demands.
Likewise, hosts are universities, cities, and communities, which places capacity in the distributed, near-user footprint that Schneider’s 50/50 central-to-edge projection implies. The facility operating system tracks tokens per watt per dollar at the site level, so utilization and cost per token are measured rather than assumed. Finally, background on the workload requirements is in AI Inference Infrastructure and the demand dynamics in The Inference Paradox.
Chad Everett Harris, Founder, SAVRN
Frequently asked questions
What was the total compute spent on AI inference in 2025 in data centers?
Instead, no audited total exists. Specifically, the best-sourced components are $318 billion of global AI infrastructure spend in 2025 ([1]), inference at roughly half of AI compute ([2]), and $18.3 billion of AI-optimized cloud infrastructure spend ([6]). Applying Deloitte’s roughly-half share to IDC’s total gives about $160 billion of inference-attributable infrastructure spend in 2025; this is arithmetic rather than a published figure.
How much electricity does AI inference use?
In fact, no agency publishes a metered inference-only figure. Global data centers instead used 485 TWh in 2025 ([3]). For example, LBNL estimated inference servers were nearly 60% of the more than 40 TWh consumed by US AI servers in 2023 ([32]). Similarly, McKinsey models 20.9 GW of global inference capacity in 2025, rising to 93.3 GW by 2030 ([37]).
What share of AI compute is inference versus training?
Estimates for 2024 to 2025 range from 30% (OpenAI’s own compute spending, per [40]) to more than 40% of NVIDIA Data Center revenue ([9]) to about 50% of all AI compute ([2]). For 2026, however, Gartner puts inference at 55% of AI-optimized IaaS spend and Deloitte at roughly two-thirds of compute.
What is the industry sector distribution of AI inference expenditures for 2023 and 2024?
No public source breaks inference spend down by industry sector for those years. Instead, the nearest data is Menlo Ventures’ enterprise generative AI spend by department for 2024 (IT 22%, Product and Engineering 19%, Support 9%) and totals of $2.3 billion in 2023 and $13.8 billion in 2024 including inference ([44]). By contrast, IDC reports buyer type, not vertical: hyperscalers and cloud providers were 86.7% of Q2 2025 AI infrastructure spend ([46]).
How much are hyperscalers spending on AI infrastructure in 2026?
Guidance as of September 2026: Alphabet $195 billion to $205 billion ([23]), Amazon about $220 billion ([25]), Microsoft about $175 billion for calendar 2026 ([21]), Meta $130 billion to $145 billion ([27]), and Oracle $70 billion for FY27 ([29]). However, none disclose an inference split.
Why is inference growing faster than training?
Reasoning models use hundreds to thousands of times more tokens per task than one-shot inference ([47]), and agents chain many such calls. For example, Google’s monthly token volume rose from 480 trillion in May 2025 to 3.2 quadrillion in May 2026 ([48]). As a result, Epoch AI estimates token demand grows about 10x per year against 3 to 4x growth in serving capacity ([50]).
What does AI inference infrastructure require that training does not?
Inference racks run at 30 to 150 kW versus 100 kW to 1 MW for training, and inference must sit near users for latency while training can be sited remotely ([52]). Because LBNL models inference servers at 40% operational time versus 80% for training ([32]), inference sites need flexible power and mixed-workload scheduling to avoid stranded capacity.
What is IDC's 2026 AI infrastructure spending forecast?
IDC forecasts global AI infrastructure spending of $497 billion for 2026, rising to $1.08 trillion by 2029 and ultimately $1.21 trillion by 2030 ([1]). The Q1 2026 figure was $89.7 billion, up 33.1% year over year, and ARM-based rack-scale systems overtook x86 in accelerated servers for the first time in Q4 2025, according to the same report. Notably, this forecast does not separate training spend from inference spend.
How much are hyperscalers spending on AI capex combined in 2025?
First, summing the 2025 actual capex figures for Microsoft, Alphabet, Amazon, Meta, and Oracle gives roughly $439 billion across the five companies, an arithmetic total that mixes fiscal and calendar years (see the capex table above). Their 2026 guidance midpoints sum to roughly $800 billion, and because none of the five companies breaks this spending down between training and inference workloads, the combined figure is a ceiling on inference-attributable capex rather than a direct estimate of it.
What is the difference between AI infrastructure spending and AI inference spending?
Specifically, AI infrastructure spending covers the full capital and operating outlay on servers, accelerators, networking, and buildings for both training and inference, and it reached $318 billion in 2025 by IDC’s count ([1]). AI inference spending is specifically the subset attributable to running trained models rather than building them, and Deloitte estimates inference made up roughly half of all AI compute in 2025 ([2]). Because no institution publishes an audited split, any inference-only dollar figure is derived by applying a share estimate to a broader infrastructure total, which is the method this article uses throughout.
Why don't hyperscalers disclose an inference-versus-training split of capex?
For instance, Microsoft, Alphabet, Amazon, Meta, and Oracle each report total capital expenditure and a general AI attribution in their filings, but none of the five discloses an inference-versus-training split of capex. The closest proxies are Microsoft’s statement that roughly two thirds of its capex is short-lived assets such as CPUs and GPUs, and Alphabet’s disclosure that about 60% of its spend goes to servers, and both figures cover training and inference hardware alike rather than separating them. Because the same GPU fleet often serves training jobs at some points and inference traffic at others, a clean accounting split would require workload-level tracking that these companies have not chosen to publish.
Sources
- IDC, “AI Infrastructure Spending Holds Near $90 Billion in Q1 2026 as ARM Overtakes x86 in Accelerated Servers; 2026 Forecast Raised to $497 Billion,” 2026.
- Deloitte, “TMT Predictions 2026: Compute power and AI,” November 18, 2025.
- IEA, “Key Questions on Energy and AI: Executive summary,” 2026.
- Gartner, “Gartner Forecasts Worldwide AI-Optimised IaaS Spending to Grow 96% in 2026,” August 11, 2026.
- Gartner, “Gartner Forecasts Worldwide AI Spending to Grow 47% in 2026,” Business Wire, May 19, 2026.
- CIO Dive, “AI-optimized IaaS spend to more than double in 2026, Gartner says,” October 2025.
- NVIDIA, “NVIDIA Announces Financial Results for Fourth Quarter and Fiscal 2026,” February 25, 2026.
- NVIDIA, “NVIDIA Announces Financial Results for Second Quarter Fiscal 2027,” August 26, 2026.
- NVIDIA Q2 FY2025 earnings call transcript, August 28, 2024 (The Motley Fool).
- Microsoft, FY2024 Q1 earnings call, October 2023.
- Microsoft, FY2024 Q2 earnings call, January 2024.
- Microsoft, FY2024 Q3 earnings call, April 2024.
- Microsoft, FY2024 Q4 earnings call, July 2024.
- Microsoft, FY2025 Q1 earnings call, October 2024.
- Microsoft, FY2025 Q2 earnings call, January 2025.
- Microsoft, FY2025 Q3 earnings call, April 2025.
- Microsoft, FY2025 Q4 earnings call, July 2025.
- Microsoft, FY2026 Q1 earnings call, October 2025.
- Microsoft, FY2026 Q2 earnings call, January 2026.
- Microsoft, FY2026 Q3 earnings call, April 2026.
- Microsoft, FY2026 Q4 earnings call, July 2026.
- Alphabet, Q4 and fiscal year 2025 results, Form 8-K Exhibit 99.1, February 2026.
- Alphabet, Q2 2026 earnings call, July 2026.
- Amazon, “Amazon.com Announces Fourth Quarter Results,” February 2026.
- CNBC, “Amazon Q2 2026 earnings,” July 30, 2026.
- Meta, “Meta Reports Fourth Quarter and Full Year 2025 Results,” January 2026.
- Meta, “Meta Reports Second Quarter 2026 Results,” July 2026.
- Oracle, “Oracle Announces Record Q4 and FY 2026 Results,” June 2026.
- Yahoo Finance, “Oracle backlog swells above Google,” June 2026.
- Morgan Stanley, “AI Market Trends 2026,” March 2026.
- IEA, “Energy and AI: Energy demand from AI,” April 2025.
- Lawrence Berkeley National Laboratory, “2024 United States Data Center Energy Usage Report,” December 2024.
- Lawrence Berkeley National Laboratory, “Modeling and Forecasting,” including the 2025 Update.
- EPRI, “Powering Intelligence 2026: Executive Summary,” February 2026.
- Schneider Electric Sustainability Research Institute, “Artificial Intelligence and Electricity: A System Dynamics Approach,” December 2024.
- The Register, “Schneider report looks at how AI energy demand may play out,” January 2, 2025.
- McKinsey, “The future of AI workloads” (chart), December 17, 2025.
- Schneider Electric, White Paper 110, “The AI Disruption: Challenges and Guidance for Data Center Design,” October 2023.
- Goldman Sachs, “The outlook for data center power demand as AI token use grows,” September 1, 2026.
- Epoch AI, “Trends” (frontier inference compute share).
- Epoch AI, “Frontier labs don’t use most AI compute,” May 20, 2026.
- Futu News, “How much computing power does the agent need? Barclays,” December 2024.
- Bain & Company, “AI Data Center Forecast: From Scramble to Strategy,” June 2026.
- Menlo Ventures, “2024: The State of Generative AI in the Enterprise,” 2024.
- Menlo Ventures, “2025: The State of Generative AI in the Enterprise,” 2025.
- IDC, “AI Infrastructure Spending Reached $82.0 Billion in 2Q25,” press release, October 28, 2025.
- NVIDIA Q1 FY2026 earnings call transcript, May 28, 2025 (Rev).
- Google, “Sundar Pichai at I/O 2026,” May 2026.
- Goldman Sachs, “AI agents forecast to boost tech cash flow as usage soars,” May 20, 2026.
- Epoch AI, “The Epoch Brief, June 1, 2026.”
- NVIDIA Q2 FY2027 earnings call transcript, August 26, 2026 (Carson Group).
- McKinsey, “The next big shifts in AI workloads and hyperscaler strategies,” December 2025.
- CNBC, “Microsoft Q4 FY2026 earnings,” July 29, 2026.
Want the next one?
When a new piece publishes on SAVRN Insights, you get one email with what it covers and a link to read it. Choose the research that interests you.
Also send me
Receive a short introduction on days 3, 7 and 14, plus the updates you select. Unsubscribe in one click. Privacy
Total Compute Spent on AI Inference in 2025: Dollars, Terawatt-Hours, and Share of the Fleet
Get new SAVRN Insights by email
A short introduction on days 3, 7 and 14, plus new SAVRN research articles. Unsubscribe at any time.
We use your address to send the introduction and updates described above. See our Privacy Policy.