Data Center Water Tracker Update: August 25, 2026
73 measures and 112 published data center water figures across all fifty states, each linked to its primary source.
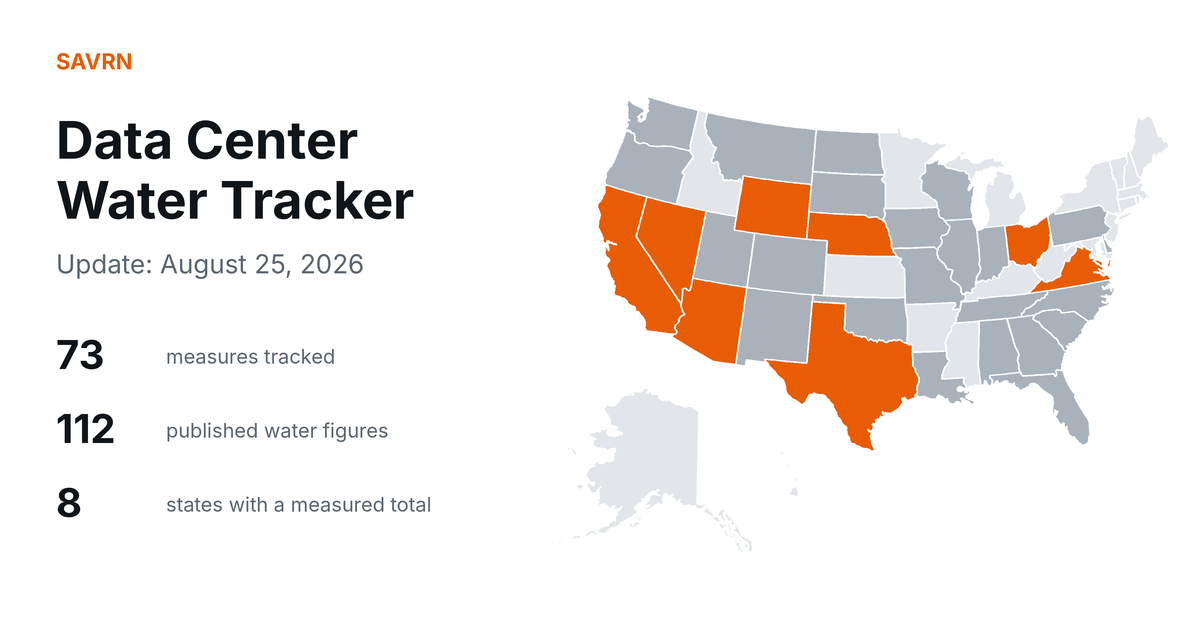
The Data Center Water Tracker now carries 73 measures across federal, state, local and interstate levels (23 federal, 27 state, 20 local, 3 interstate), 23 of them enacted, alongside 112 published data center water figures covering all fifty states. Every entry links to its primary source.
New published water figures (15, in 14 states)
Each figure carries its own basis, period, scope and source. Figures on different bases are never compared or summed, and a permit limit, allowance or projection is listed as evidence rather than drawn as a measured bar.
- AZ: ≤96.5 acre-ft/yr (~31.4 million gal) (Withdrawal — permitted ceiling, 2025 permit documents). Named facility: Project Blue, Tucson. Source
- CO: Up to 805,000 gal/day (Use — legislative-report projection, 2026). Named facility: CoreSite north Denver. Source
- DE: 2,737,500 gal/yr (Discharge (permit-application volume), Filing Jan 12, 2026). Named application: Delaware data center. Source
- FL: Up to 50,000 gal/day (Use — development-agreement allowance, 2026). Named facility: Fort Meade LLC / Stonebridge, Fort Meade. Source
- GA: 12 mgd combined use; 3.16 mgd returned (>9 mgd evaporated) (Use / discharge — DRI disclosures, 2026). Partial-industry aggregate: 16 disclosing GA data centers (14 additional did not disclose). Source
- IN: 31 mgd (Construction dewatering discharge — county-approved, 2026). Named facility: Amazon New Carlisle. Source
- LA: >23 mgd; 8.4 billion gal/yr (Withdrawal — registered ceiling, Current registration). Named facility: Meta Hyperion, Richland Parish. Source
- MT: ~16 million gal/yr; ~44,000 gal/day annual avg; 267,000 gal/day summer avg (Use — projection at full build-out (200 MW), Committee report Feb 2026). Named facility: Sabey Butte, Montana Connections Industrial Park. Source
- ND: 0.00486 mgd (4,860 gal/day) (Discharge — NDPDES-authorized (seasonal), Application Nov 1, 2023; public notice May 15, 2024). Named facility: APLD Jamestown. Source
- NM: 213.40 acre-ft/yr (~69.5 million gal) (Use — reported average annual, 2025). Named facility: Meta Los Lunas. Source
- PA: 0.129 mgd (129,000 gal/day), 30-day avg (Consumption — SRBC-approved limit, Approved Sept 12, 2024; increased Mar 12, 2026). Named facility: Amazon Data Services PHL100, Salem Twp., Luzerne Cnty.. Source
- PA: 0.060 mgd, 30-day avg (Consumption — SRBC application estimate (Bldgs 2 & 3), Application 2024-056; ops start July 2025). Same Amazon PHL100 campus, 1125 Electron Ave.. Source
- SD: ~4,000 gal/month total; ~200,000 gal initial fill; 0.314 gal/server/month (Use — closed-loop fill and make-up (30:70 glycol:water), Filing Nov 7, 2024). Named facility: Leola Data Center. Source
- WA: ~210 million gal/yr implied (10% of ~2.1 billion gal/yr city groundwater used by data centers for cooling) (Use — municipal withdrawal share as characterized by EPA, Case study period; reuse utility operational June 30, 2021). City of Quincy data-center cluster. Source
- WI: 1.2 mgd (Use — contracted municipal supply allowance (Lake Michigan via Port Washington), 2025 agreement in force). Named facility: Lighthouse campus (Vantage, for Oracle/OpenAI), Port Washington. Source
The standing position
- 8 states have a published statewide or regional measured aggregate and draw a bar: AZ, CA, NE, NV, OH, TX, VA, WY.
- 23 states have published figures at facility or instrument level only, with no state total.
- 19 states have no measured data center water volume published by anyone.
That ratio is the tracker’s central finding. The disclosure bills it follows exist because this figure is, almost everywhere, not collected.
The full tracker, with every state’s file, the federal accordion, and all sources, is at savrn.com/data-center-water-tracker. All citations are on the sources page.
Would you like the weekly update?
Every week we re-verify every water measure on this tracker and publish what changed. You get one email when it goes out.
Also send me
Receive a short introduction on days 3, 7 and 14, plus the updates you select. Unsubscribe in one click. Privacy
Data Center Water Tracker Update: August 25, 2026
Get new SAVRN Insights by email
A short introduction on days 3, 7 and 14, plus new SAVRN research articles. Unsubscribe at any time.
We use your address to send the introduction and updates described above. See our Privacy Policy.