How We Write AI Infrastructure Emails Officials Actually Read
We write research, not pitches, for legislators, officials and university leaders. Here is the structure, shown on one real email, and what 4,957 sends do and do not prove.
Is the AI data center boom breaking?
In October, that was the question I kept hearing from officials on our list. So it was the question our AI infrastructure emails answered first, in the third line, before we said a word about ourselves.
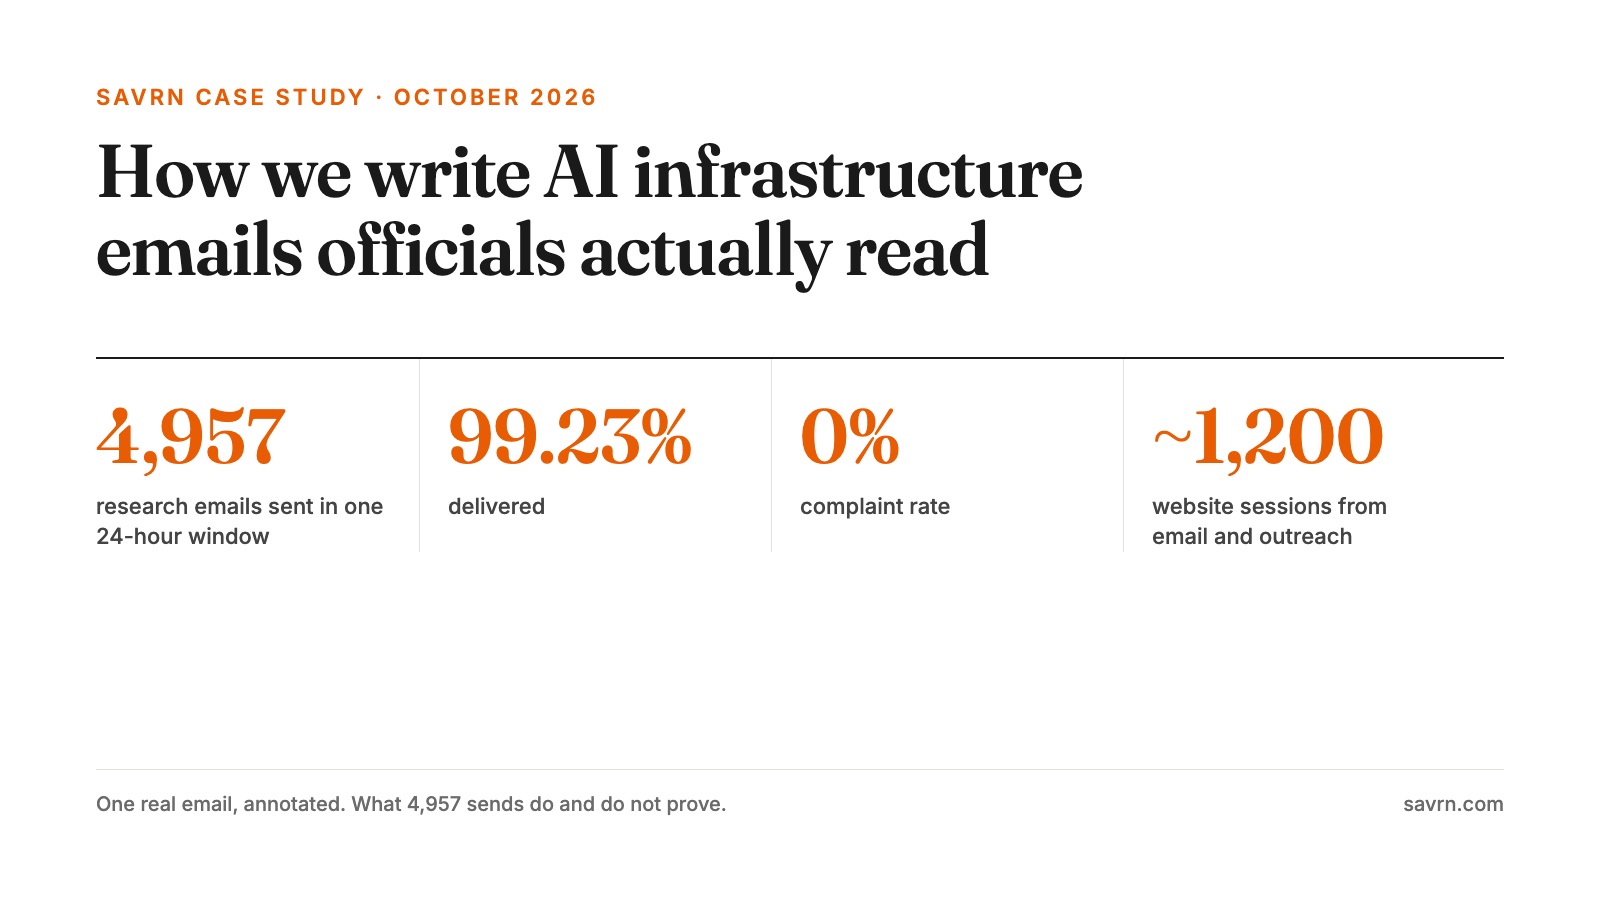
In one 24-hour window we sent 4,957 of those emails, to state legislators, county officials, university leaders and the people who run infrastructure. Not one was marked as spam. Here is exactly how we write them, shown on one real email, and what the numbers prove and, in particular, what they do not.
First, the numbers. Of the 4,957 emails, 99.23% were delivered. The dashboard also reported a 46.04% open rate and a 30.33% click rate. Those are high for cold institutional email. However, I want to be careful with them, and I explain why below.
Step 1: Write for the person who gets asked
Most of the people on our lists are not buyers. Rather, they are state legislators, county officials, university administrators, economic development staff and people who run infrastructure.
They are, in fact, the people who get asked about data centers every week. For example, a project shows up in their district. Then a headline says the boom is over. Meanwhile, a constituent asks about the power bill. They need to understand what is going on, while most of what they read is either a press release or a scare story.
Therefore we decided to send them something useful. We did not send a pitch. Instead, we sent research they can read in three minutes and use the next day.
Step 2: Answer the question they already have
Here is one example. In mid-October, CoreWeave’s bonds sold off, and as a result I got a lot of questions. Most of them came down to one: is the AI data center boom breaking?
My short answer was no. The email explained why with a simple picture. An AI data center is not one business. In fact, it is four businesses sharing the same land and the same power:
- Developer. Finds the land and the power, and builds the building.
- Operator. Runs the building: power, cooling and security.
- GPU cloud. Buys the chips and rents out computing time. This is where CoreWeave sits.
- AI company. Uses that computing to sell AI services.
The October stress was in the third layer. CoreWeave has about $104 billion of contracted future revenue. However, it borrows heavily to buy chips. In the first half of 2026 it spent about $10.45 billion more on equipment than its operations brought in. When lenders got nervous, its bonds fell. Even so, it has not missed a payment. Specifically, its own second quarter 2026 results lay out the revenue, backlog and spending.
By contrast, the rest of the market looked very different in the same quarter. Vacancy in major North American markets was 1.4%. In addition, about 80% of capacity under construction was already leased. Moreover, the H100 rental list price was up 3.8% since we began tracking it in our GPU Price History.
So demand is strong. Instead, what is being tested is how part of it is financed.
Step 3: Build the email so the click is easy
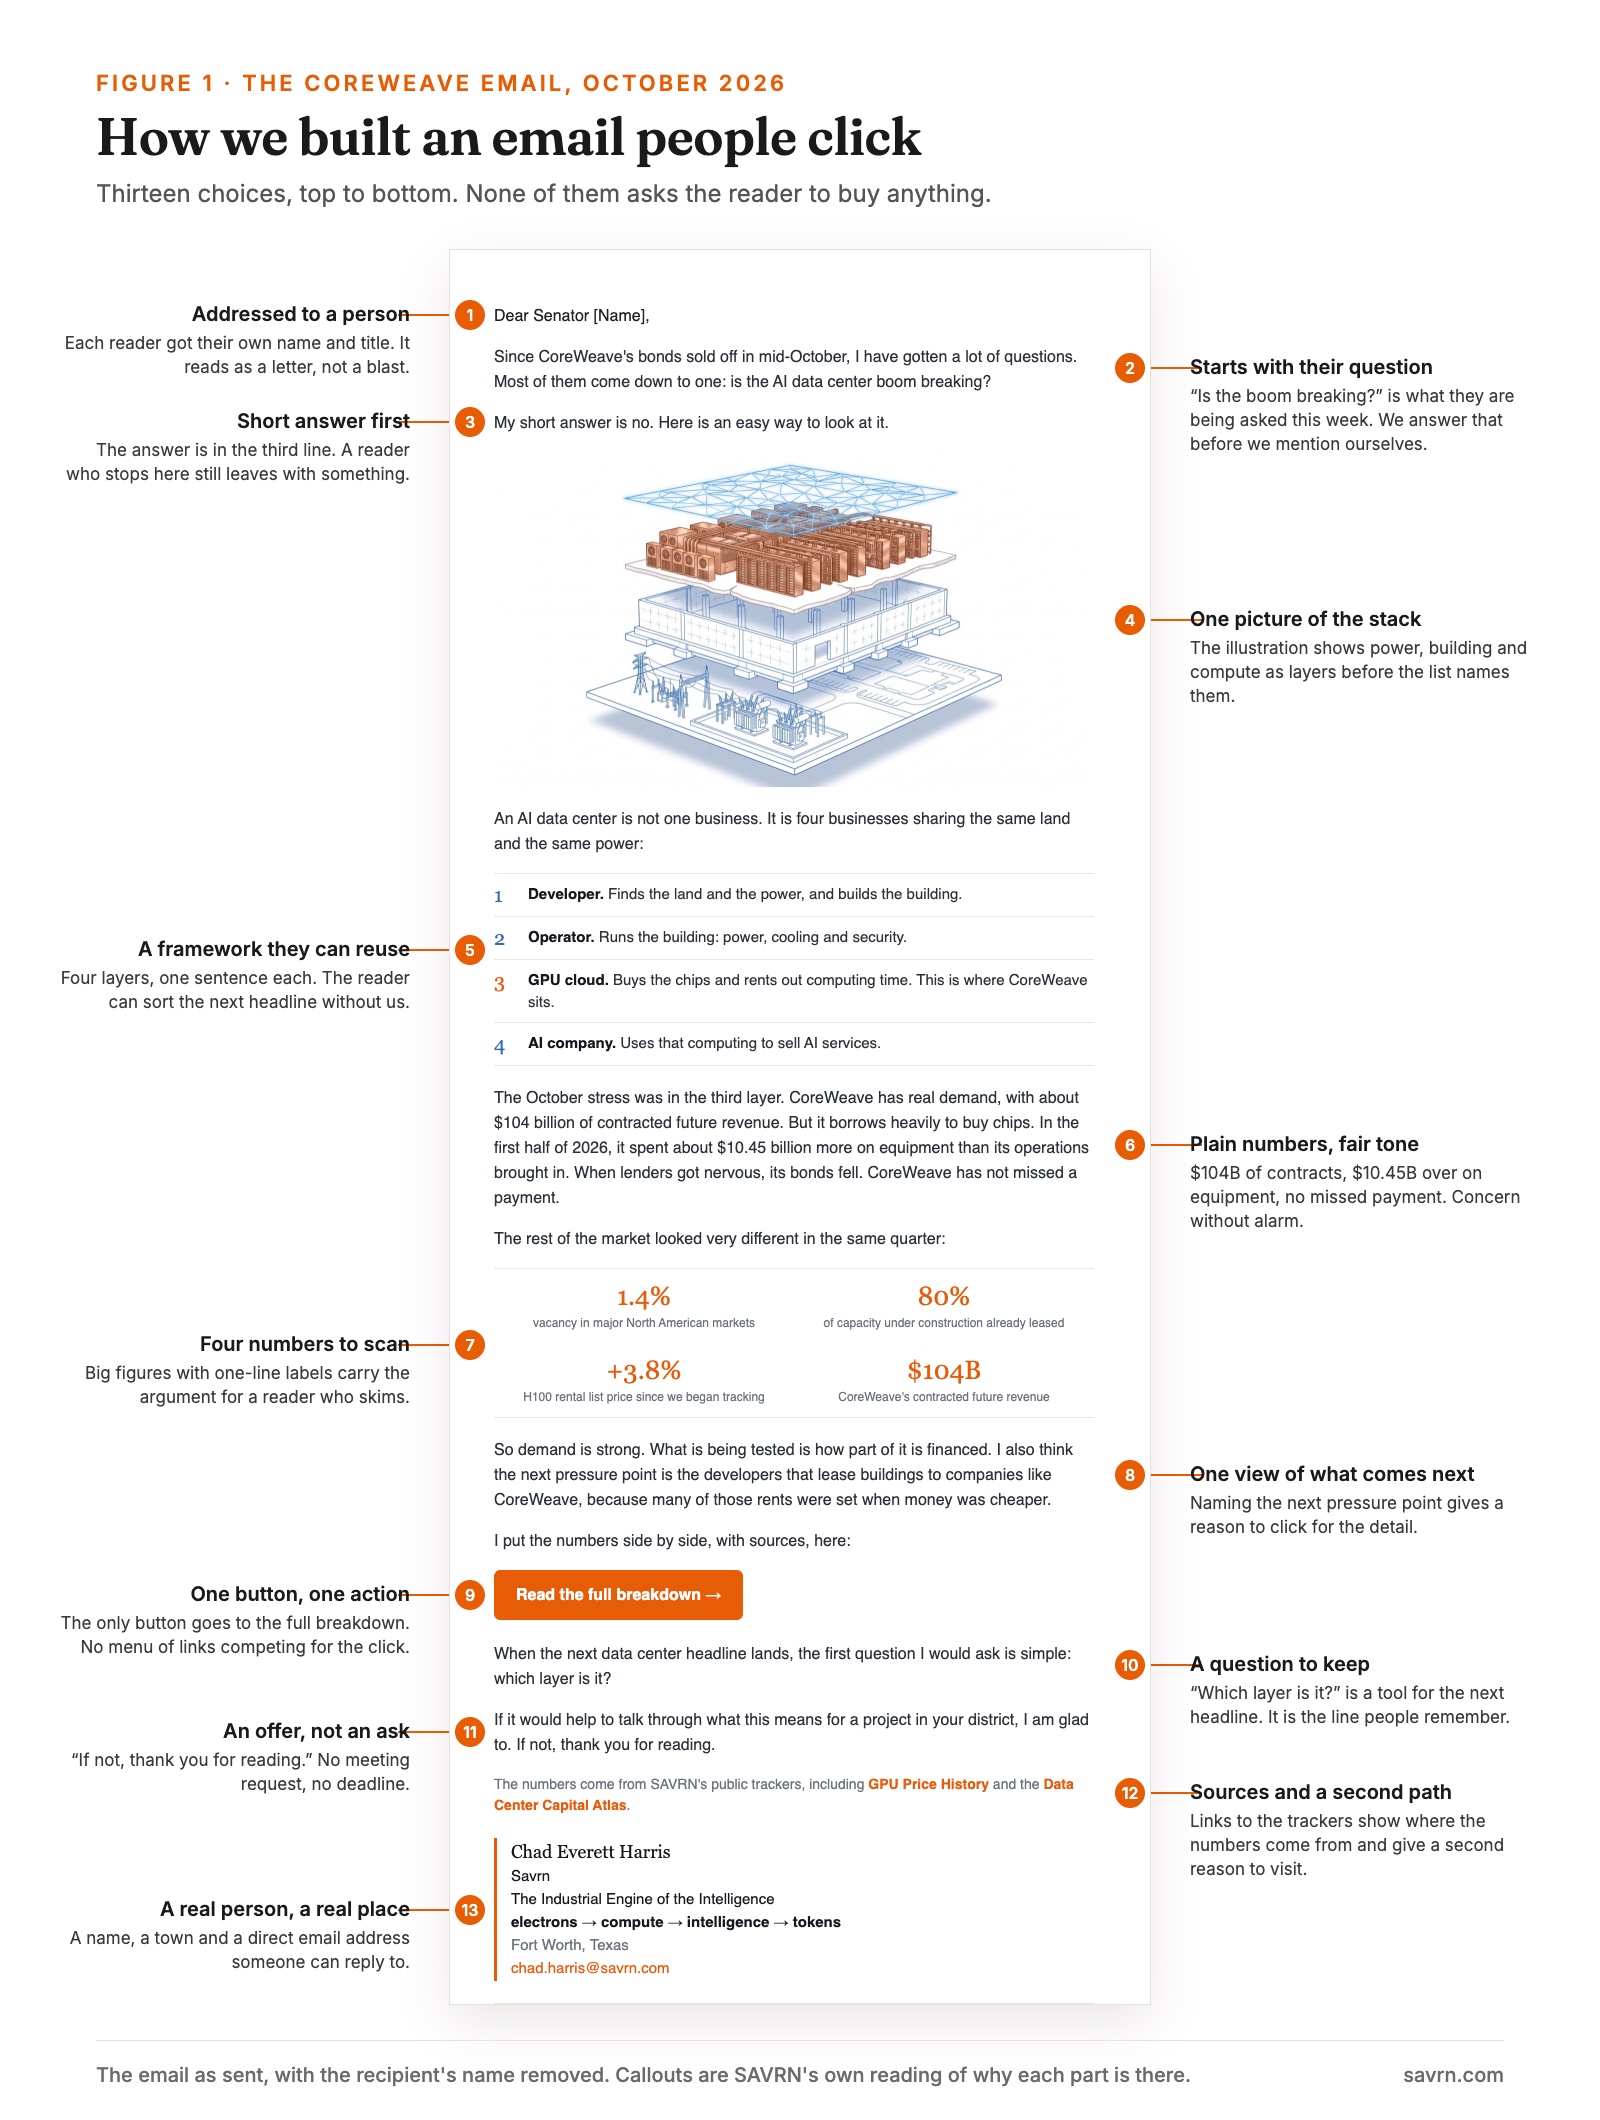
Figure 1 walks through the email from top to bottom. We have not tested each piece on its own, so these are the choices we made and why, rather than proof that each one works.
Still, a few of them carry most of the weight. First, the email opens with the reader’s question, not ours. Second, the answer comes in the third line, so a busy reader gets value even if they stop there. Third, the four-layer list gives them a tool they can use on the next headline without us.
Then the email earns the click. For instance, it gives four numbers a skimmer can take in at a glance. It also names one thing we think comes next, which is a reason to want the detail. After that there is exactly one button, the link to the full breakdown. As a result, the reader never has to choose between links.
Finally, it ends with an offer instead of an ask. “If not, thank you for reading” tells the reader they owe us nothing. Ultimately, we think that is what makes people willing to open the next one. Even if the reader never writes back, they leave with a way to read the next data center headline: which layer is it?
Step 4: Be straight about the numbers
The numbers in Table 1 are real. However, they are also aggregate. Specifically, they cover every email across our four sending domains in that window, not only the CoreWeave email.
Two things can inflate them:
- Opens. Apple Mail Privacy Protection and similar features load images automatically. As a result, that counts as an open even if nobody read the message.
- Clicks. Many government and university mail systems run security scanners that follow every link before a person sees the email. Consequently, that also counts as a click.
Therefore I do not claim 46% of officials read our email. Instead, I claim the dashboard reports 46%, and the true human number is lower by an amount we have not yet measured.
What I trust more is the website side. Google Analytics shows email and outreach as a major source of new visitors, with about 1,200 sessions, next to about 1,600 direct sessions. By comparison, organic search was only 55. (A session in Google Analytics is a group of actions by one visitor in one sitting.) Because the report did not show its date range, I will not stitch these into one funnel with the email numbers. Nevertheless, the direction is clear: email is how people find us right now.
In addition, our own marketing system logged visitors spending about two to two and a half minutes on the research in the sessions we watched. That is not an average, and it is not a cohort. Therefore it is a reason to measure more carefully, not a result to brag about.
One more thing. Our open rates were already high before we cleaned up our Cloudflare and Resend setup this month. That work fixed email authentication and traffic attribution. In other words, it did not create the interest. Instead, the content did, or at least the subject did.
Step 5: Watch which topics pull
The differences between our publications tell me the most.
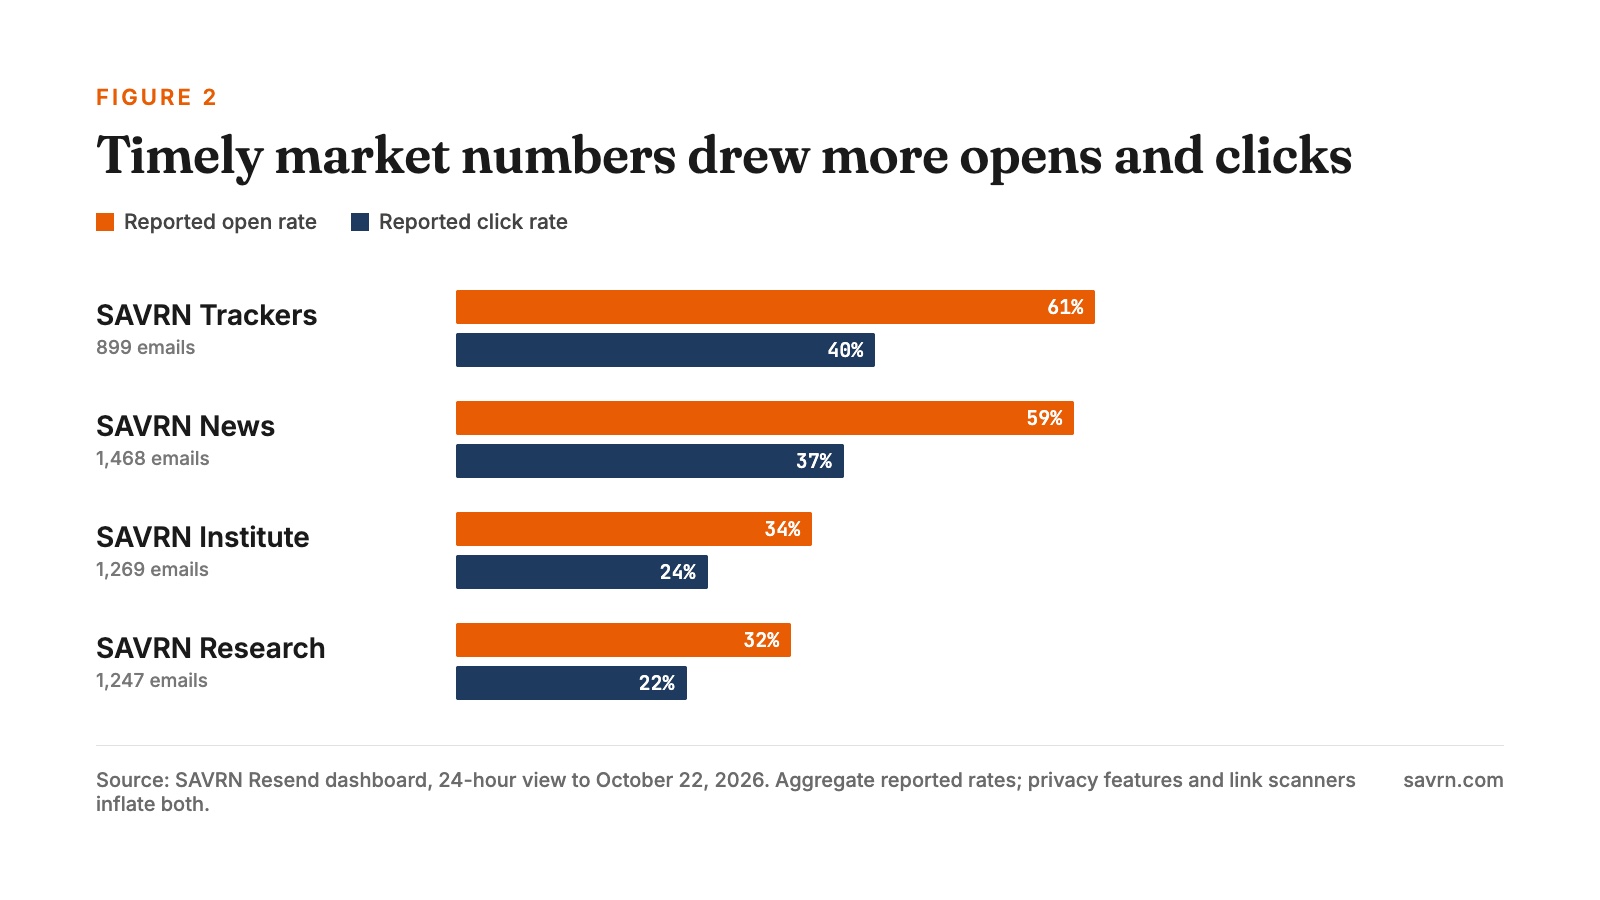
Trackers and News, which carry timely market numbers, reported opens near 60% and clicks near 40%. On the other hand, Institute and Research, which carry longer and more general pieces, reported opens near 33% and clicks near 23%. Same sender, same infrastructure, same filters. Therefore the variable is how close the content sits to a decision the reader has to make this week.
That is the lesson. In a technical industry, people pay attention to clear explanations of things that affect them. They do not need to be sold. Rather, they need to understand.
An open rate is not trust, though. Instead, trust shows up as repeat readers, people who find us through search, people who cite our numbers, referrals, and real conversations about real projects. We have some of those. However, we do not yet have enough data to prove them at scale.
Why this matters past our own inbox
SAVRN builds AI data centers. In addition, we build the software we run the company on: research tools, trackers, a publishing system, an email system and the analytics behind it.
While looking at these numbers, I realized we had built something other infrastructure companies need.
Here is a common situation. A company has land, power and fiber. It also has a customer interested in AI computing capacity. Although the opportunity is real, the company still has to:
- confirm what the site can support: power, cooling, interconnection and deployment limits;
- turn that into a clear offer with costs, contract terms and dependencies;
- explain the offer to customers, lenders, universities and public officials;
- build a market presence people take seriously;
- find and engage the right buyers and partners;
- write the proposal and close the deal.
Today those jobs are spread across engineering firms, financial advisers, marketing agencies, consultants and sales teams. Each one sees part of the picture, since each was hired for one job. As a result, nobody owns the whole thing.
Instead, we think one platform can tie them together. It has five parts:
- Infrastructure intelligence. Site evaluation, energy needs, utility limits, facility design and project economics, turned into a plan someone can act on.
- Solution and commercial packaging. Technical packages, business cases, capital needs, operating models, risk analysis and proposal documents.
- Research-led market development. Explainers, trackers and briefings written for the questions the customer’s audience is actually asking. This is the part we have tested on ourselves, for example with the Data Center Capital Atlas.
- Distribution and audience measurement. Getting that research to the right people, then measuring delivery, site visits, real reading and return visits.
- Commercial execution. Account research, sales materials, partner coordination and managing qualified opportunities through to a contract.
To be clear about where we are: parts 3 and 4 are working inside SAVRN today, and the numbers above come from them. Delivering all five together for outside companies is the goal. However, it is not a result yet.
How we plan to measure it
If we are going to offer this to other companies, then we have to hold ourselves to better numbers than open rates. Specifically, Figure 3 shows the ladder we are using.
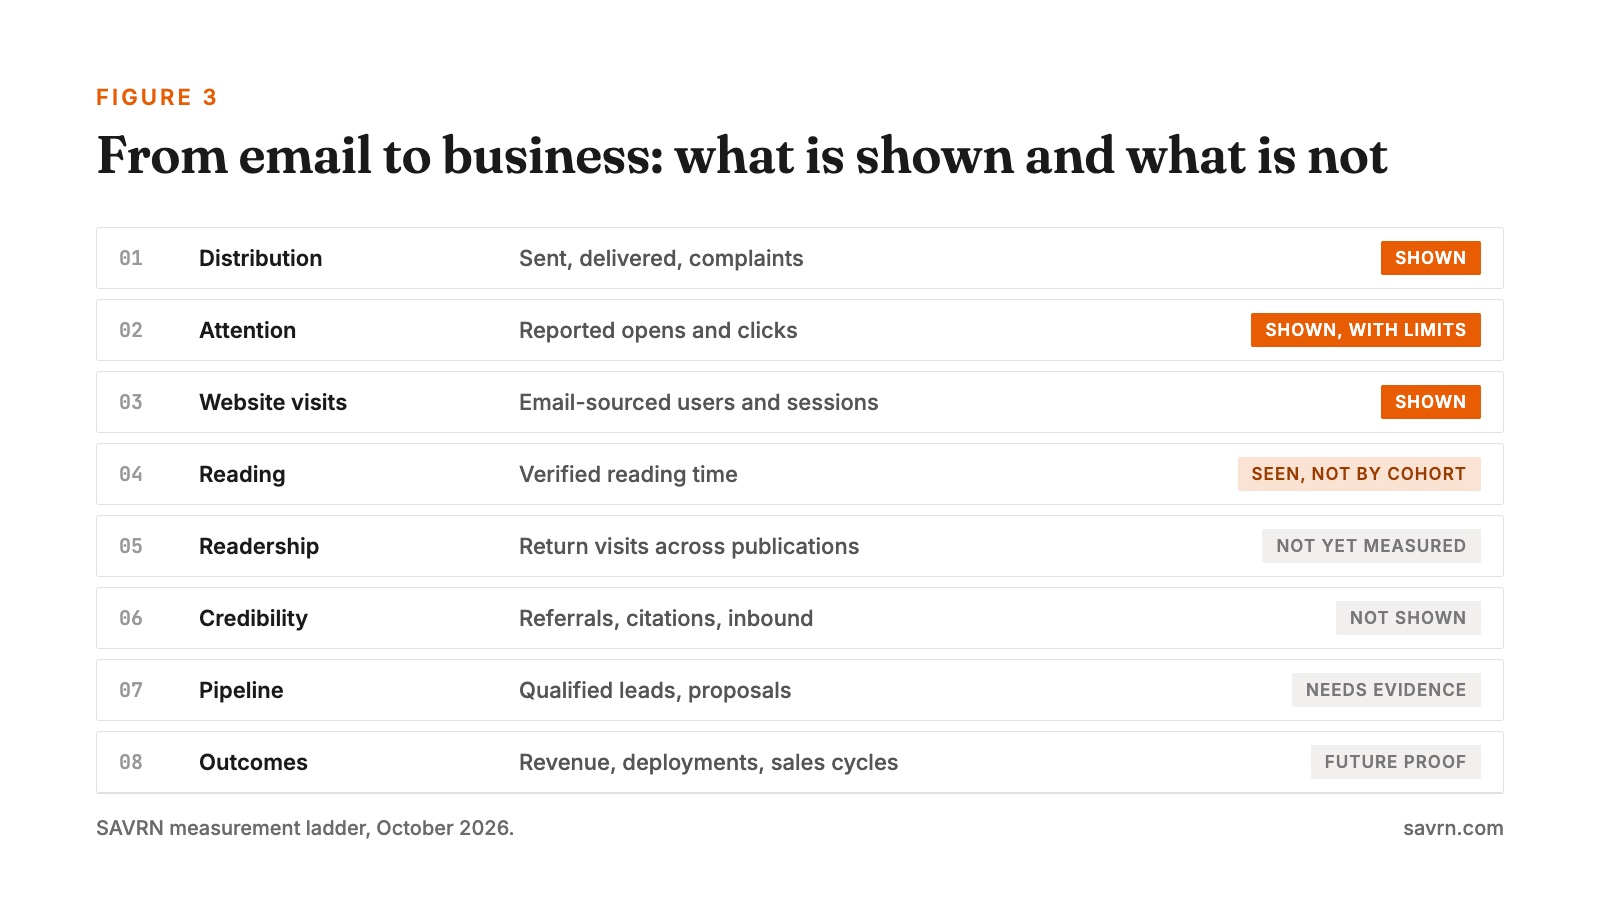
In particular, two new numbers will sit at the center of it.
The first is a Verified Research Engagement Rate: of the people who received an email, the share who then had a real human session on our research, with bots filtered out and a minimum bar such as 60 seconds of active reading. The 60 seconds is our own standard, not an industry one. Google Analytics uses 10 seconds for its own engaged session by default, which is too low a bar for research.
The second is a 30-Day Repeat Reader Rate: of those engaged readers, the share who come back for more research within 30 days.
The first tells us if we got attention. The second, by contrast, tells us if we are building a readership. We will not publish either number until the event definitions, time windows and bot filtering are checked.
Where this goes
Ultimately, the physical side still matters most. Power, buildings, networks and chips are the hard part, and we build them.
However, a site with power is not a business until someone can explain it, price it, sell it and sign it. As a result, too many good infrastructure projects stall in that gap.
We started by building a system to help people understand AI infrastructure. Since then, we have been working toward a system that can also help other companies turn infrastructure opportunities into real businesses.
We tested it on ourselves first. Next, we have to show it works for someone else.
Chad Everett Harris is the founder of SAVRN. Figures come from SAVRN’s Resend dashboard and Google Analytics as of October 22, 2026. CoreWeave and market figures come from SAVRN’s October email and public trackers.
Frequently asked questions
How many emails did SAVRN send, and how many were delivered?
SAVRN sent 4,957 emails in one 24-hour window ending October 22, 2026. Of those, 99.23% were delivered, the bounce rate was 0.77% and the complaint rate was 0%.
Does a 46% open rate mean 46% of readers read the email?
No. Instead, 46.04% is the rate the dashboard reports. Privacy features such as Apple Mail Privacy Protection can register an open without a person reading, so the human rate is lower by an amount we have not yet measured.
Why might the 30% click rate be overstated?
Many government and university mail systems scan every link before a person sees the email. Those scans can count as clicks, so the reported 30.33% includes some clicks no person made.
Who receives SAVRN's research emails?
Mostly state legislators, county officials, university administrators, economic development staff and people who run infrastructure. They are not mainly buyers. Instead, they are people who get asked about data centers.
Which SAVRN publications got the most engagement?
SAVRN Trackers and SAVRN News did best, with reported opens of 61% and 59% and clicks of 40% and 37%. By contrast, SAVRN Institute and SAVRN Research reported opens of 34% and 32% and clicks of 24% and 22%.
How should you structure an AI infrastructure email to officials?
Start with the question the reader is already being asked, and answer it in the first few lines. Then give one framework, a few plain numbers and exactly one link. Finally, close with an offer instead of an ask, because the reader should owe you nothing.
Is the AI data center boom breaking?
Our answer in October 2026 was no. Vacancy in major North American markets was 1.4%, and about 80% of capacity under construction was already leased. What is being tested is how part of the GPU cloud layer is financed.
How much website traffic came from email?
Google Analytics showed about 1,200 sessions from email and outreach, about 1,600 direct sessions and 55 from Google organic search. The report did not show its date range, so we have not joined it to the email numbers.
What is the Verified Research Engagement Rate?
It is a metric SAVRN plans to use: the share of email recipients who then have a real human session on our research, with bots filtered out and at least 60 seconds of active reading. We will not publish a number until the definitions are checked.
Does SAVRN offer this system to other companies?
That is the goal. However, research publishing and distribution work inside SAVRN today. Delivering infrastructure intelligence, packaging, research, distribution and commercial execution together for outside companies is not a result yet.
Sources
- CoreWeave Q2 2026 results; CoreWeave, "CoreWeave Reports Strong Second Quarter 2026 Results," August 2026. Revenue, backlog and capital spending.
- The data center industry is not one business; SAVRN, October 22, 2026. The full four-layer breakdown behind the CoreWeave email, with its own sources.
- GPU Price History; SAVRN Index. H100 rental list price change since tracking began.
- Data Center Capital Atlas; SAVRN. Who is funding AI data centers, 2024 to 2026.
- Use Mail Privacy Protection; Apple Mail User Guide. How Apple Mail loads remote content privately, which can register opens.
- About Analytics sessions; Google Analytics Help. How a session is defined.
- Engagement rate and bounce rate; Google Analytics Help. The default engaged-session definition.
- Sending emails; Resend documentation. The sending service behind the dashboard figures.
Want the next one?
When a new piece publishes on SAVRN Insights, you get one email with what it covers and a link to read it. Choose the research that interests you.
Also send me
Receive a short introduction on days 3, 7 and 14, plus the updates you select. Unsubscribe in one click. Privacy
How We Write AI Infrastructure Emails Officials Actually Read
Get new SAVRN Insights by email
A short introduction on days 3, 7 and 14, plus new SAVRN research articles. Unsubscribe at any time.
We use your address to send the introduction and updates described above. See our Privacy Policy.